Stocks were mostly higher last week, but there were some pockets of weakness. QQQ led the broader market with a 1.59% gain and IWM lagged as the ETF fell a fraction (-.02%). The consumer discretionary and technology sectors gained and showed relative strength last week. The finance, energy and utilities sectors were lower and showed relative weakness. Energy stocks are in strong downtrends and this sector is by far the weakest of the nine. Utility stocks are in long-term uptrends and the November decline may be a correction within these uptrends. Financial services is the biggest sector in the Russell 2000 and weakness in this group weighed on small-caps.
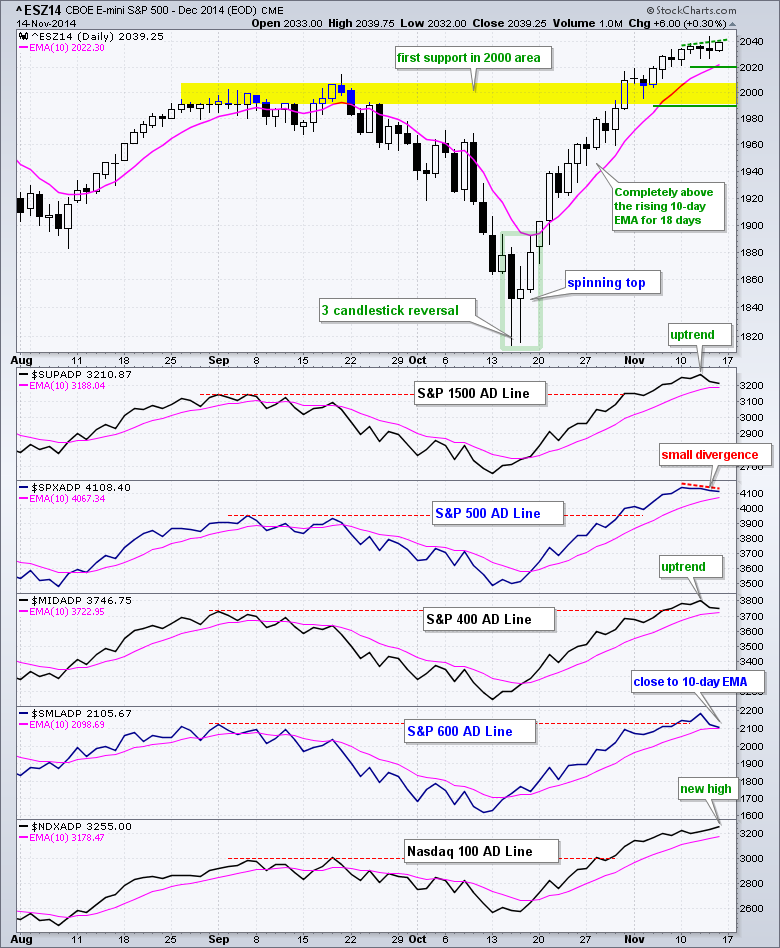
The first signs of weakness appeared in the broader market last week. On a closing basis, the S&P 500 closed at a new high on Friday, but the AD Line did not close at a new high and formed a small bearish divergence. Even though this bearish divergence is very small, it could foreshadow short-term weakness because stocks are ripe for a pullback. Also note that the S&P 500 closed up four of five days last week, but S&P 500 AD Percent ($SPXADP) was negative three of five days. Similarly, the S&P Small-Cap 600 closed higher three of five days last week, but S&P SmallCap AD Percent ($SMLADP) was negative three of five days. Breadth is not keeping pace with price and this shows some underlying weakness in the market. I would not consider this a medium or long-term issue, just a short-term issue that could lead to a correction or pullback in the coming days or weeks.
**This chart analysis is for educational purposes only, and should not
be construed as a recommendation to buy, sell or sell-short said securities**
Short-term Overview (17-November-2014):
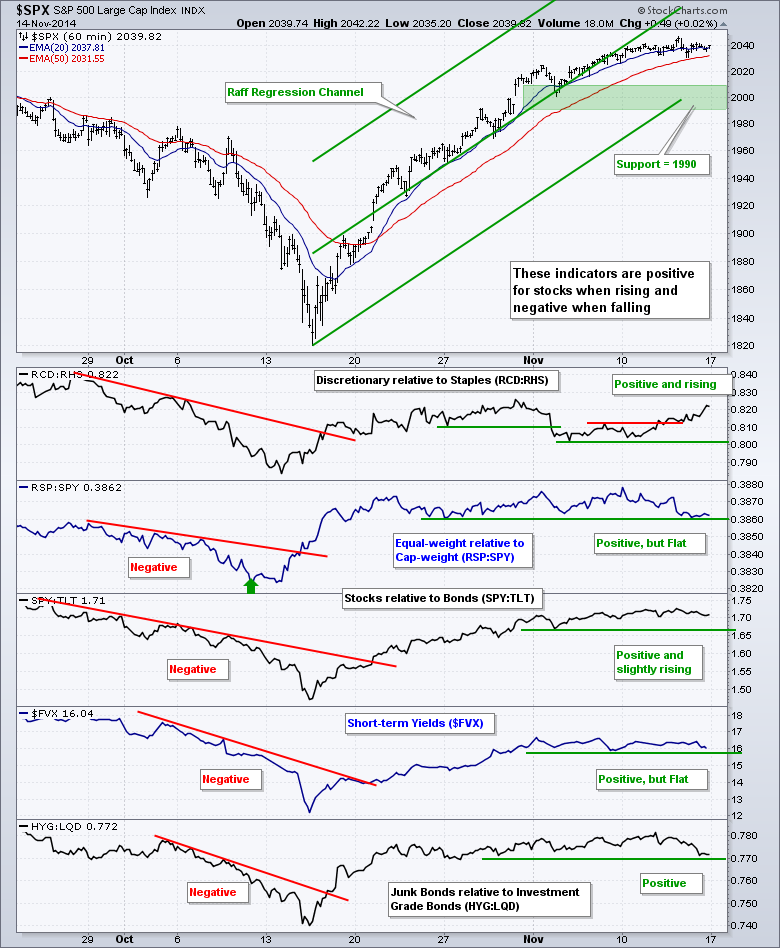
- Three of the five risk factors are flat and close to turning negative.
- The five AD Lines are rising, but the S&P 500 AD Line formed a small bearish divergence.
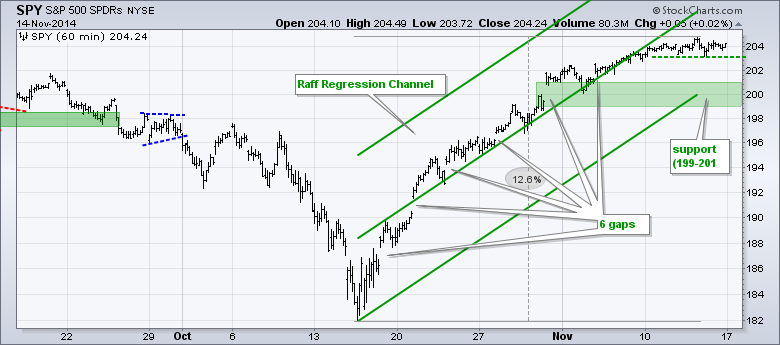
- SPY consolidated within a tight range as indecision reigned and key support remains at 199.
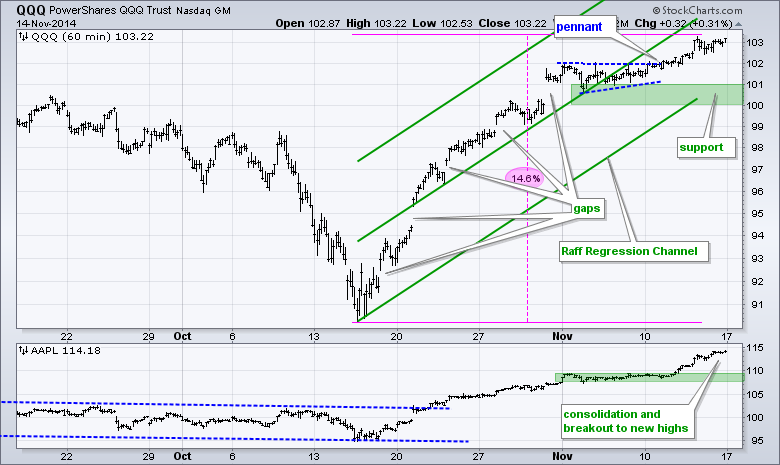
- QQQ hit a new high last week and support remains at 100.
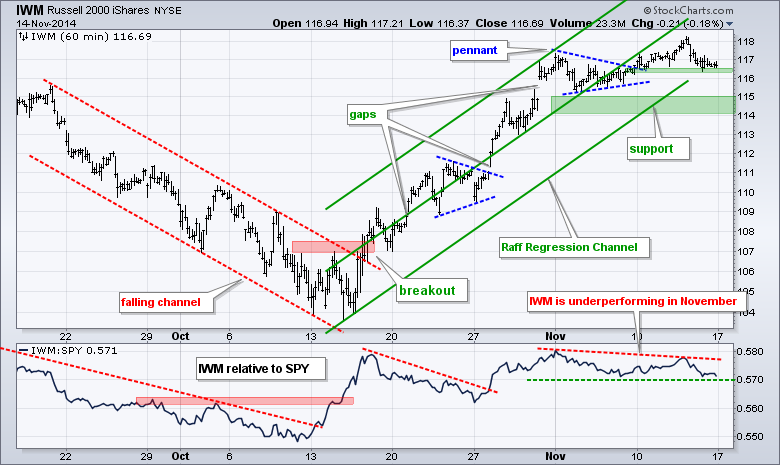
- IWM fell back to the pennant breakout and support remains at 114.
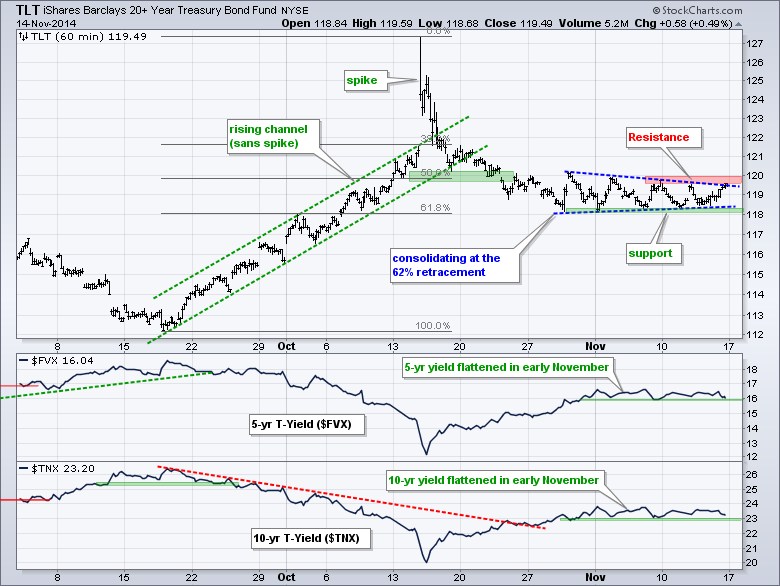
- TLT is showing resilience near a key retracement and I am watching resistance at 120 for a breakout.
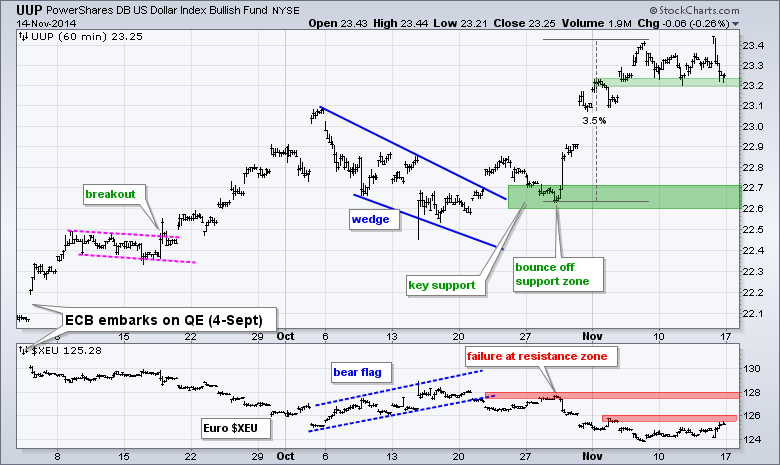
- UUP is struggling to hold gains and is testing first support.
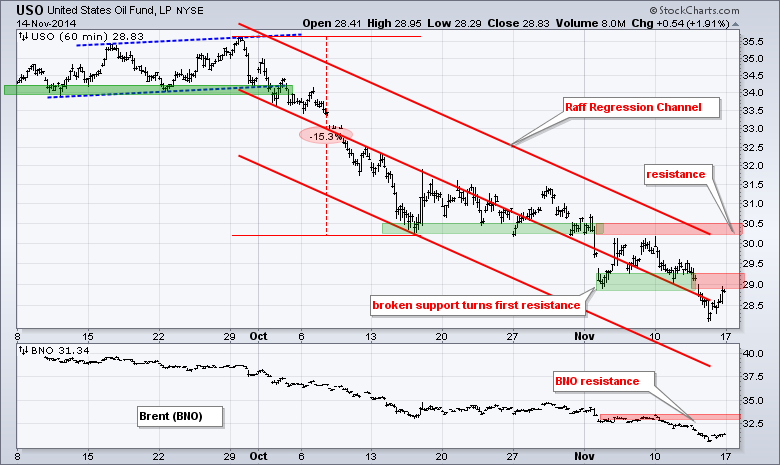
- USO surged on Friday, but remains in a downtrend and at first resistance.
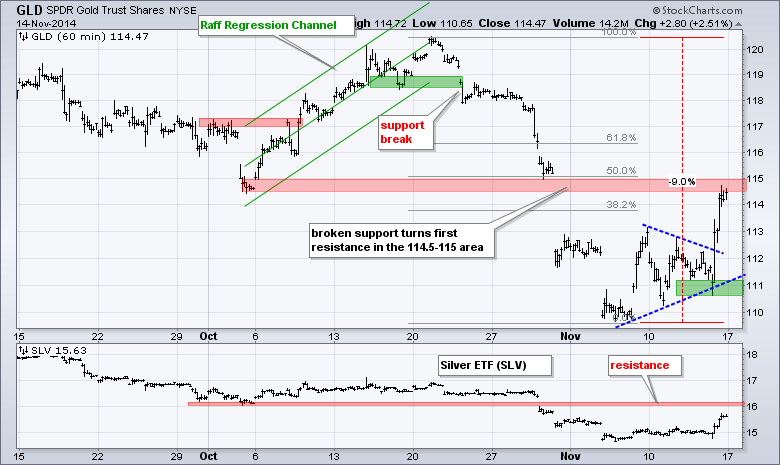
- GLD broke triangle resistance and surged to a key retracement.
All five risk indicators remain positive for stocks, but three of the five flattened and it would not take much to push them into negative territory. Consumer discretionary outperformed consumer staples last week and SPY continued to outperform TLT. Those two are firmly positive for stocks. The Equal-Weight S&P 500 ETF (RSP) has performed flat relative to the S&P 500 SPDR (SPY) since 20-October and one day of relative weakness would turn the RSP:SPY ratio negative. Relative weakness in the equal-weight S&P 500 would suggest underlying weakness in the index. Even though the economic reports have been positive this month, the 5-year Treasury Yield ($FVX) traded flat and remained below its early November high. This is unexpected and a move below the early November low would suggest that money is moving into relative safety, which would be negative for stocks. And finally, the High-Yield Bond ETF (HYG) fell sharply last week and underperformed the Investment Grade Bond ETF (LQD). Another day of relative weakness would turn the HYG:LQD ratio negative for stocks. This means three indicators are just one day away from turning negative.
SPY moved above 204 on Monday and then traded flat the rest of the week. The ETF traded between 203 and 205 the entire week and closed between 203.9 and 204.25 five straight days. That is an extraordinarily tight range that shows some serious indecision. A break below 203 would provide the first hint of a pullback. I am still looking for support sooner rather than later and will keep key support in the 199-201 area.
**************************************************************
QQQ surged above 101 in late October, consolidated with a pennant and broke out last week. The ETF finished near its high of the week and shows relative strength. The breakout zone around 102 marks first support. The Raff Regression Channel, pennant lows and a buffer mark key support. The indicator window shows Apple breaking consolidation support and moving to a new high ahead of the holiday season.
**************************************************************
IWM surged in late October, consolidated with a pennant in early November and broke pennant resistance last week. The ETF hit a new high for the move at 118, but fell back to the breakout zone for its first support test in the 116.5 area. IWM is showing relative weakness in November and a pullback in the broader market could hit small-caps harder. I will leave key support in the 114-115 area for now.
**************************************************************
Given the positive economic reports in early November and better-than-expected retail sales report last week, I would have expected the 20+ YR T-Bond ETF (TLT) to break support and move lower. It did not and this could foreshadow an upside breakout. TLT spiked above 127 in mid October and then fell back to the 118 area in late October. The ETF is at an interesting juncture because it retraced 62% of the prior decline, which is normal for a correction within an uptrend. A break above 120 would break consolidation resistance and signal an end to the consolidation. Key support is set at 118.
**************************************************************
The US Dollar ETF (UUP) failed to hold above 23.4 twice and fell to support in the 23.20 area. Even though the big trend is up, the ETF is entitled to a breather within the uptrend and a break below the early November lows would argue for a pullback. I will leave key support in the 22.6-22.7 area because the bigger trend is up.
**************************************************************
The USO Oil Fund (USO) got a big bounce on Friday, but still closed down for the week and remains in a clear downtrend. Broken support in the 30.5 area turns resistance and the upper line of the Raff Regression Channel extends to this area as well. USO broke down again last week and broken support in the 29-29.3 area turns first resistance.
**************************************************************
The Gold SPDR (GLD) continued its volatile ways with a dip below 111 in the morning and subsequent surge above 114. This move broke triangle resistance and carried gold to the 50% retracement. The short-term trend must be considered up, but this move is not enough to affect the long-term downtrend. Broken support and the 50% retracement turn resistance in the 115 area.
***************************************************************
Key Reports and Events (all times Eastern):
Mon - Nov 17 - 08:30 - Empire State Manufacturing
Mon - Nov 17 - 09:15 - Industrial Production
Tue - Nov 18 - 08:30 - Producer Price Index (PPI)
Tue - Nov 18 - 10:00 - NAHB Housing Market Index
Wed - Nov 19 - 07:00 - MBA Mortgage Index
Wed - Nov 19 - 08:30 - Housing Starts
Wed - Nov 19 - 10:30 - Crude Oil Inventories
Wed - Nov 19 - 14:00 - FOMC Minutes
Thu - Nov 20 - 08:30 - Initial Claims
Thu - Nov 20 - 08:30 - Consumer Price Index (CPI)
Thu - Nov 20 - 10:00 - Existing Home Sales
Thu - Nov 20 - 10:00 - Philadelphia Fed
Thu - Nov 20 - 10:00 - Leading Economic Indicators
Thu - Nov 20 - 10:30 - Natural Gas Inventories
Charts of Interest are on Tuesdays and Thursdays.
This commentary and charts-of-interest are designed to stimulate thinking. This analysis is not a recommendation to buy, sell, hold or sell short any security (stock ETF or otherwise). We all need to think for ourselves when it comes to trading our own accounts. First, it is the only way to really learn. Second, we are the only ones responsible for our decisions. Think of these charts as food for further analysis. Before making a trade, it is important to have a plan. Plan the trade and trade the plan. Among other things, this includes setting a trigger level, a target area and a stop-loss level. It is also important to plan for three possible price movements: advance, decline or sideways. Have a plan for all three scenarios BEFORE making the trade. Consider possible holding times. And finally, look at overall market conditions and sector/industry performance.


