Stocks were hit with some selling pressure on Friday, but SPY ended the week with a small gain and QQQ ended the week at a new high. The gains continue to be incremental and the advance is slowing, but it is still an advance and selling pressure remains subdued in large-caps. Small-caps are relatively weak and would likely lead lower on any pullback in the broader market. It is, however, the beginning of the month and the stock market has a pretty strong bullish bias the first few days of the month. It is also a big week for economic reporting with over a dozen key reports. The ISM Manufacturing Index kicks things off on Monday morning, Auto-Truck Sales are Tuesday and the employment report is Friday. Based on past reports, the economy shows signs of growth and the labor market continues to slowly improve. In addition, the decline in oil prices could help the economy because it will free up more money for retail spending and reduce energy-related expenses for companies.
**This chart analysis is for educational purposes only, and should not
be construed as a recommendation to buy, sell or sell-short said securities**
Short-term Overview (Monday, 1-December-2014):
- The short-term evidence is still bullish on balance, but some negatives are creeping into the picture.
- Four of the five AD Lines hit new highs and remain in uptrends, but the small-cap AD Line formed a bearish divergence.
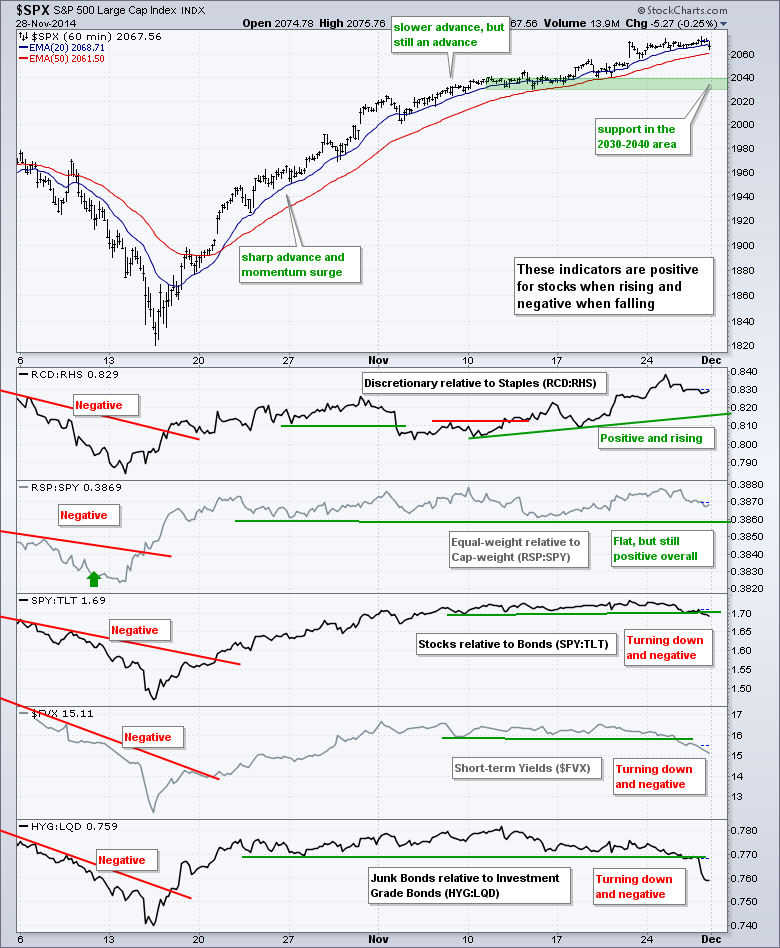
- The three bond-related indicators suggest risk-off and the two stock-specific indicators are still risk-on.
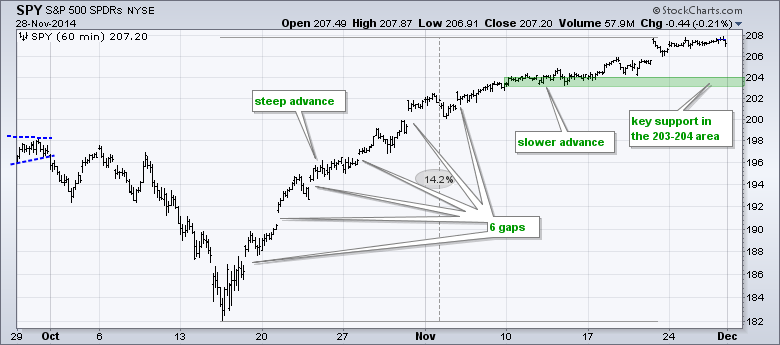
- SPY hit a new high last Wednesday and key support is set in the 203-204 area.
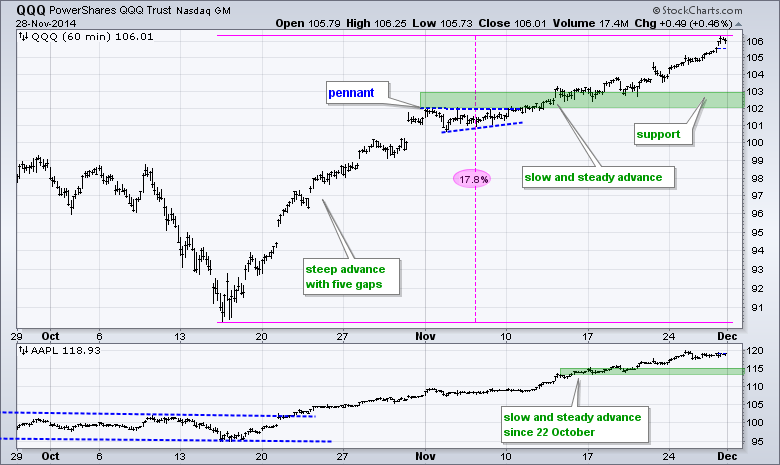
- QQQ is leading with a new high on Friday and key support is set in the 102-103 area.
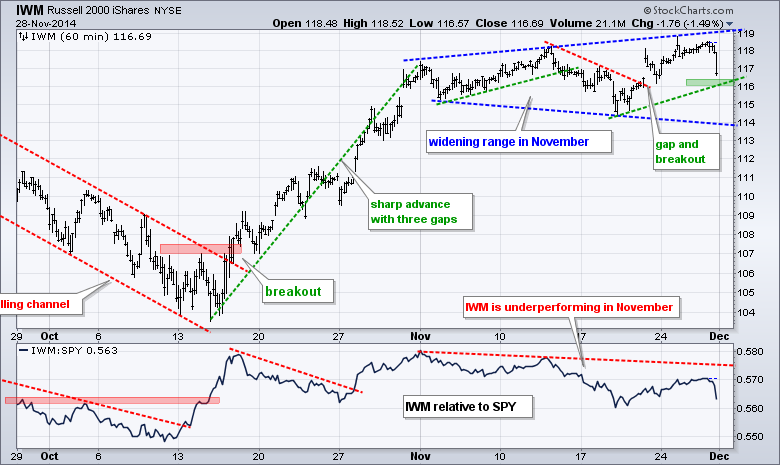
- IWM is in an upswing with support at 116, but showing relative weakness.
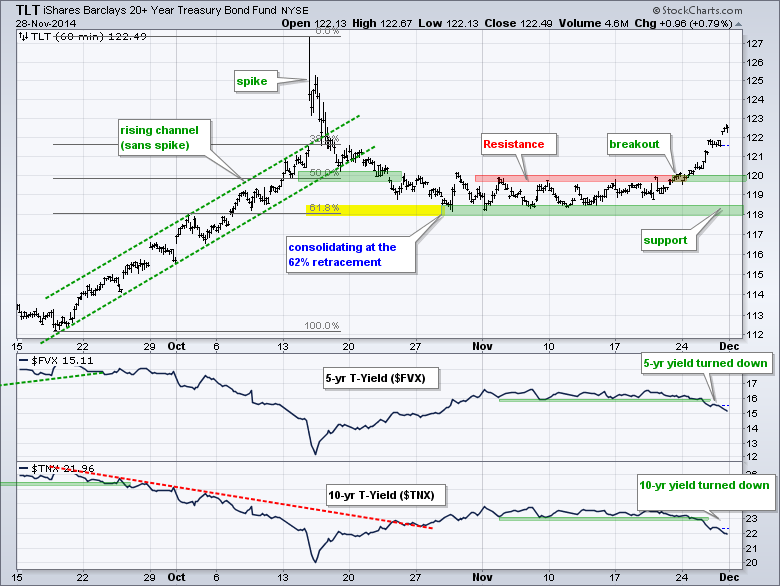
- TLT broke out on 21-Nov and key support is set at 118.
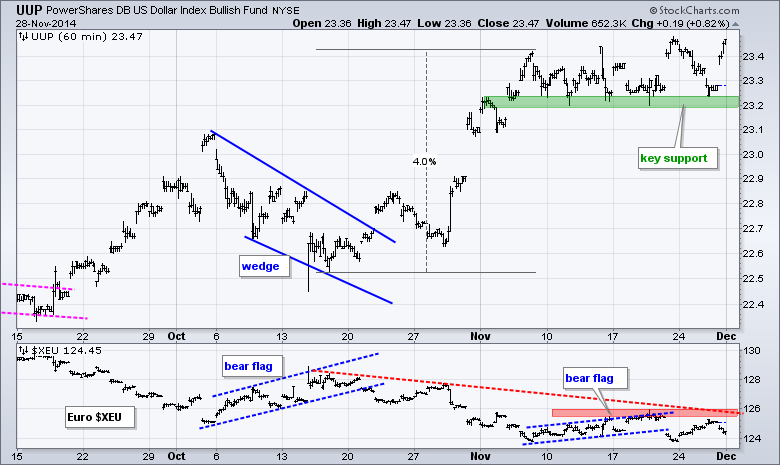
- UUP bounced off support to extend it uptrend and the Euro failed at resistance.
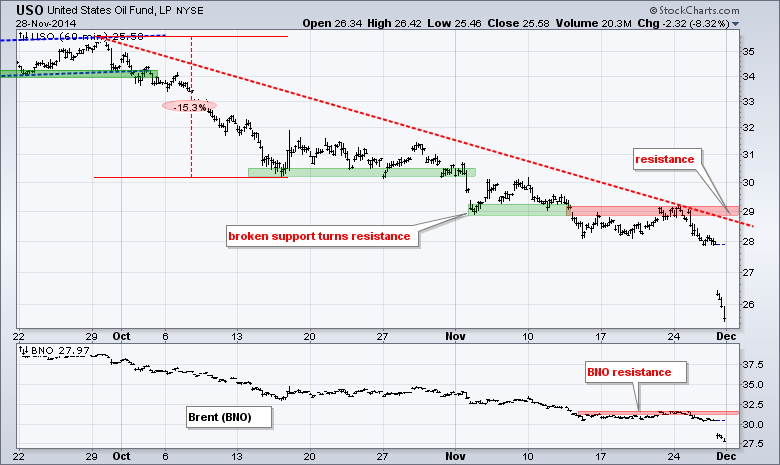
- USO plunged to another new low on Friday and remains in a strong downtrend.
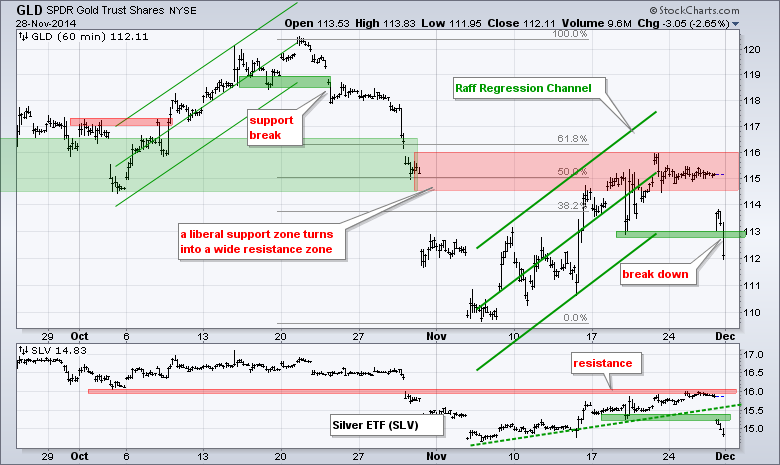
- GLD reversed in its resistance zone and broke down on 28-Nov.
The December E-mini S&P 500 (^ESZ14) hit a new high on Wednesday and edged lower on Friday. Overall, this steady uptrend extended as the E-mini continued to hold its 3-day low, which is the lower band of the 3-day price channel.
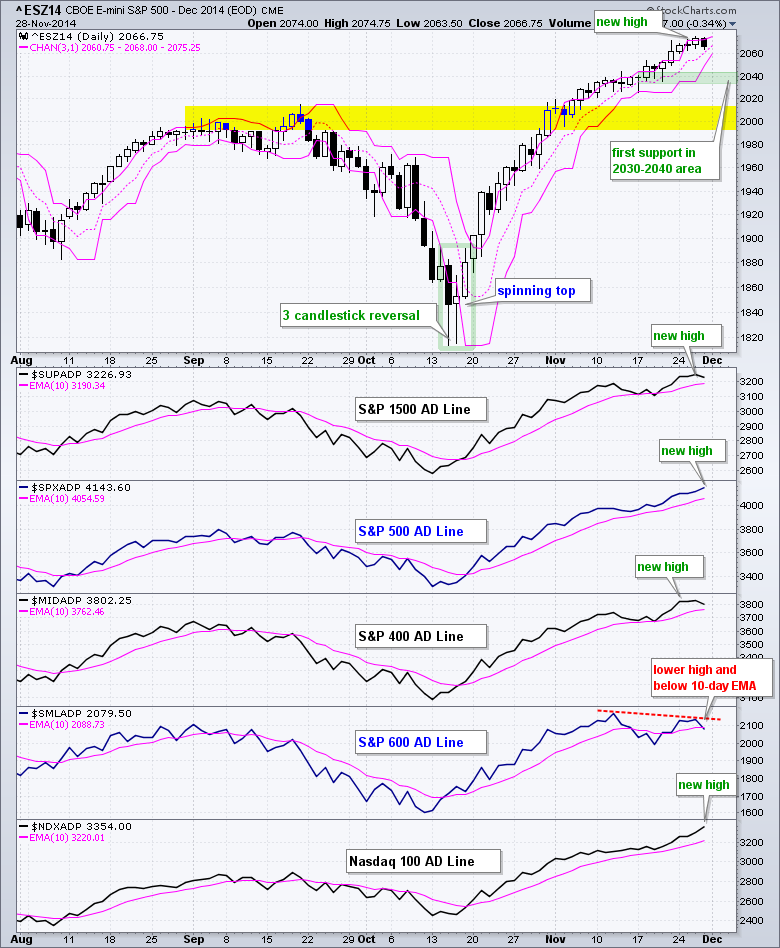
Four of the five AD Lines hit new highs last week, but only the S&P 500 and Nasdaq 100 AD Lines hit new highs on Friday. Small-cap performance tailed off over the last few weeks as the S&P Small-Cap 600 AD Line formed a small bearish divergence and moved below its 10-day EMA. Once again, the small-cap AD Line is clearly the weakest of the lot.
Three of the five risk indicators are negative and the three negative indicators are bond related. First, note that the XLY:XLP ratio is rising and positive for stocks. Second, note that the RSP:SPY ratio remains flat and has yet to break down. On the bond side, stocks started underperforming bonds as the 20+ YR T-Bond ETF fell and the 5-year Treasury Yield rose. Strength in bonds stems from weakness in oil and other commodities because this weakness keeps inflation at bay. Junk bonds are lagging investment grade bonds because energy-related issuers are being hit by the decline in oil prices.
There is not much change in the S&P 500 SPDR (SPY). The ETF surged in the second half of October and continued higher at a slower pace in November. SPY has not moved much since the gap above 207 on November 21st though. Using the mid November lows, I am marking key support in the 203-204 area.
**************************************************************
QQQ continues to lead the major index ETFs with a new high on Friday. Notice that QQQ also gapped up on November 21st, but did not stall much and moved steadily higher last week. The ETF may seem overbought and ripe for a correction, but there are no signs of selling pressure right now. The mid November lows mark a support zone in the 102-103 area.
**************************************************************
IWM remains messy. Even though the ETF hit a new high for the move, it continues to underperform and small-cap breadth remains weak. On the price chart, the ETF shows a broadening type formation with three swings. The current upswing started with the gap and breakout on November 21st. I am marking support at 116 and a break below this level would reverse this upswing.
**************************************************************
The 20+ YR T-Bond ETF (TLT) broke out on November 21st and continued higher last week. The plunge in energy prices is keeping inflation in check and this is bullish for bonds. On the price chart, TLT broke a long consolidation with the move above 120 and this breakout held. Broken resistance turns first support and I am leaving key support at 118 for now. The indicator windows show Treasury yields moving lower.
**************************************************************
The US Dollar ETF (UUP) fell back to support on Wednesday, but then surged as oil moved sharply lower. Even though it seems counter intuitive, it appears as if the plunge in oil boosted the greenback. On the price chart, UUP surged off support and ended the week near its high of the month. Key support is set in the 23.3 area. The indicator window shows the Euro Index ($XEU) breaking flag support and the flag high turning into resistance in the 126 area.
**************************************************************
The USO Oil Fund (USO) firmed for over a week and then plunged to new lows after the OPEC meeting. It is basically a supply issue because OPEC kept its quotas, fracking continues and Iran may even increase production in the coming months if talks progress. USO is once again oversold, but still in a clear downtrend with resistance marked in the 29 area.
**************************************************************
The Gold SPDR (GLD) took its cue from oil and fell off a cliff on Friday. Note that gold was already in a long-term downtrend and GLD reversed right where it should have. Even though it was a wide zone, broken support and the 62% retracement marked resistance in the 115-116 area. The ETF reversed here and broke support at 113 with a sharp decline Friday. This signals a continuation of the long-term downtrend and projects a move to new lows in bullion.
***************************************************************
Key Reports and Events (all times Eastern):
Mon - Dec 01 - 10:00 - ISM Manufacturing Index
Tue - Dec 02 - 10:00 - Construction Spending
Tue - Dec 02 - 14:00 - Auto-Truck Sales
Wed - Dec 03 - 07:00 - MBA Mortgage Index
Wed - Dec 03 - 08:15 - ADP Employment Report
Wed - Dec 03 - 10:00 - ISM Services Index
Wed - Dec 03 - 10:30 - Crude Oil Inventories
Wed - Dec 03 - 14:00 - Fed's Beige Book
Thu - Dec 04 - 07:30 - Challenger Job Report
Thu - Dec 04 - 08:30 - Initial Jobless Claims
Thu - Dec 04 - 10:30 - Natural Gas Inventories
Fri - Dec 05 - 08:30 - Employment Report
Fri - Dec 05 - 10:00 - Factory Orders
Fri - Dec 05 - 15:00 - Consumer Credit
Charts of Interest are on Tuesdays and Thursdays.
This commentary and charts-of-interest are designed to stimulate thinking. This analysis is not a recommendation to buy, sell, hold or sell short any security (stock ETF or otherwise). We all need to think for ourselves when it comes to trading our own accounts. First, it is the only way to really learn. Second, we are the only ones responsible for our decisions. Think of these charts as food for further analysis. Before making a trade, it is important to have a plan. Plan the trade and trade the plan. Among other things, this includes setting a trigger level, a target area and a stop-loss level. It is also important to plan for three possible price movements: advance, decline or sideways. Have a plan for all three scenarios BEFORE making the trade. Consider possible holding times. And finally, look at overall market conditions and sector/industry performance.


