Stocks were mostly higher on Wednesday with the major index ETFs posting modest gains. SPY advanced .63% and the Russell 2000 iShares (IWM) added just .18%. The energy sector rebounded with a big move as oil got a small bounce. Devon (DVN) and EOG Resources (OEG) exceeded their late October highs to show some relative strength within the group. Utilities were exceptionally strong as the XLU surged over 2% and hit another new high. Gold mining stocks were slammed again as gold and silver extended their free fall.
**This chart analysis is for educational purposes only, and should not
be construed as a recommendation to buy, sell or sell-short said securities**
**************************************************************
Short-term Overview (6-November-2014):
-
Four of the five risk indicators are positive for stocks.
-
The Major Index AD Lines are all rising and positive.
-
SPY, QQQ and IWM remain in clear uptrends and support is unchanged.
-
TLT remains in a slight downtrend ahead of Friday's employment report.
-
UUP is in a clear uptrend and the ECB meets on Thursday.
-
USO bounced back to the support break, but remains in a downtrend.
-
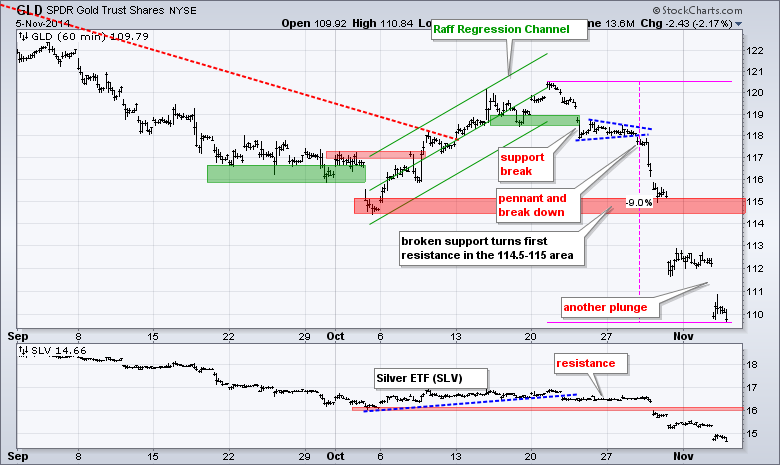
GLD became even more oversold with another plunge.
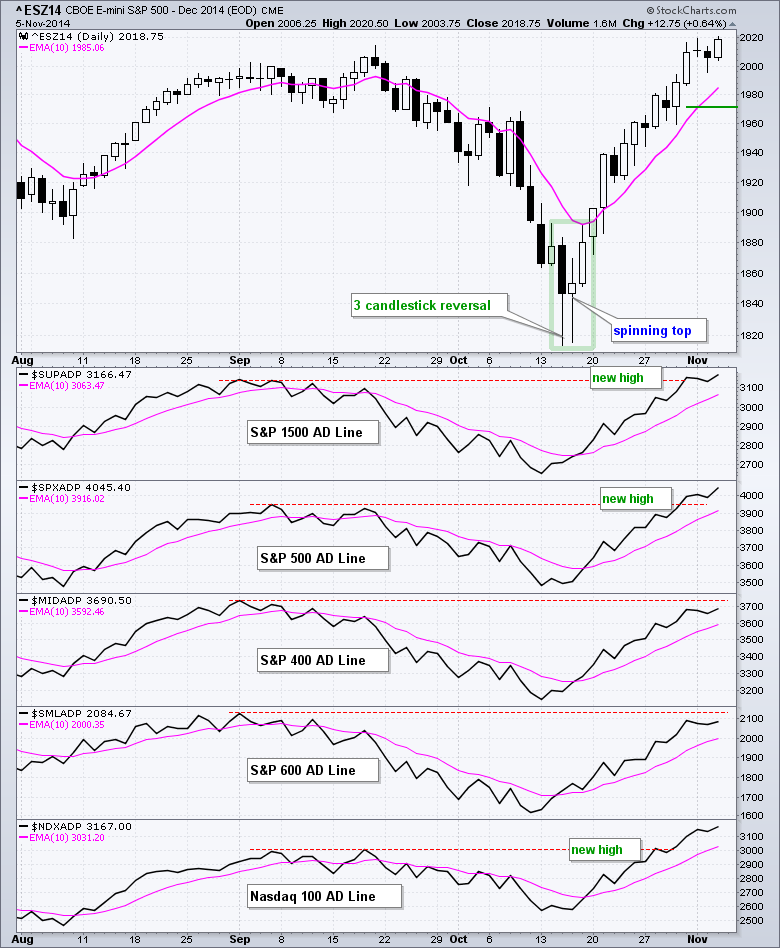
We will start with the e-mini chart and then look at the risk on-off indicators. The December E-mini S&P 500 (^ESZ14) closed near 2020 and at its highest closing level of the year. The possibility of a bearish candlestick reversal has been removed and I left key support at 1970 for now. The indicator windows show the five major index AD Lines in clear uptrends and above their rising 10-day EMAs. No signs of weakness here.
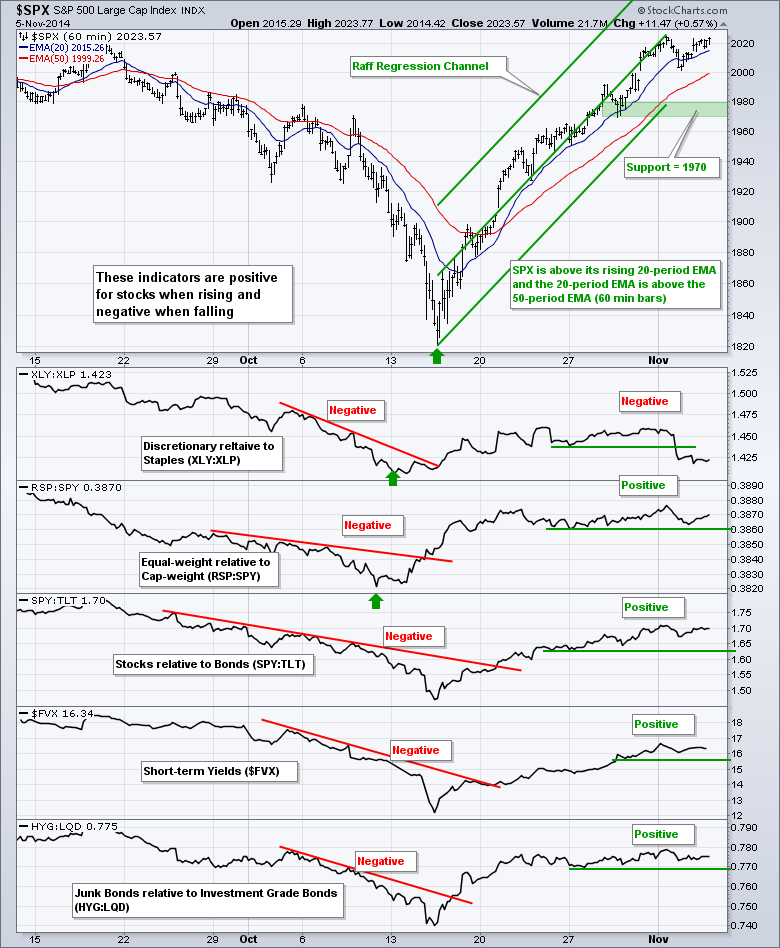
Four of the five Risk-on/Risk-off indicators remain positive for stocks. Keep in mind that this is a short-term chart based on 60-min data. The XLY:XLP ratio broke down and remains below this support break. This means the consumer discretionary sector is lagging the consumer staples sector (thanks to AMZN and PCLN). The other four indicators are still trending higher and positive for stocks.
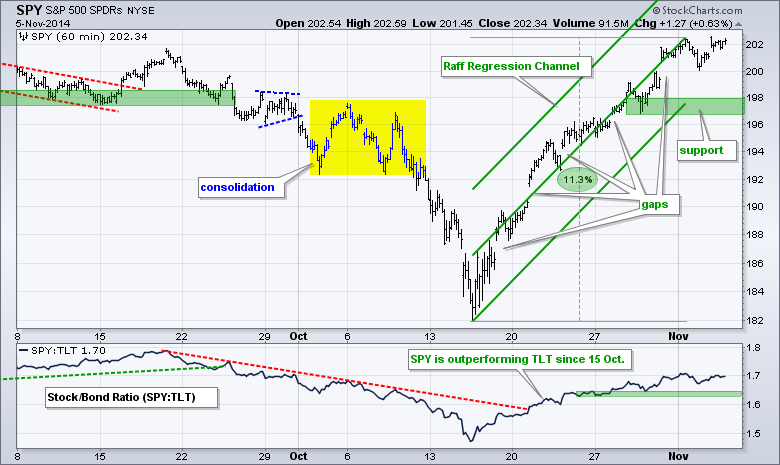
No change. SPY remains in an uptrend with the Raff Regression Channel and 29-Oct low marking key support in the 197-198 area. Keep in mind that the Raff Regression Channel extends from the closing low to the close high of the current move. This is why it stops at Monday's high. I will extend the channel if SPY moves above this high.
**************************************************************
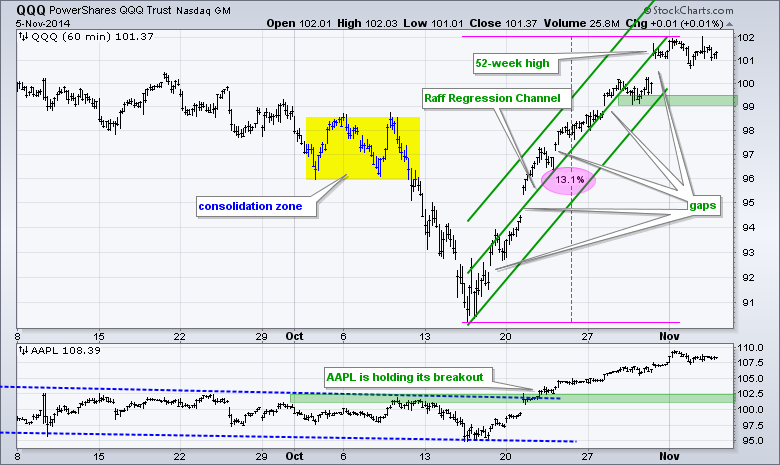
No change. QQQ remains in an uptrend with the Raff Regression Channel and 29-Oct low marking key support in the 99-99.5 area.
**************************************************************
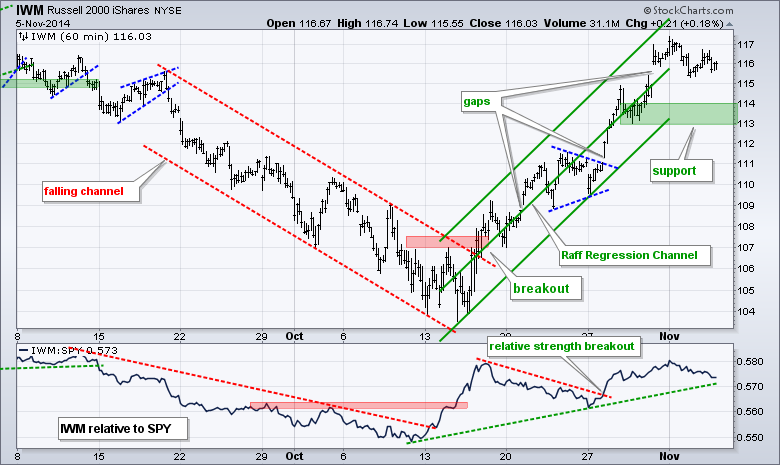
No change. IWM remains in an uptrend with the Raff Regression Channel and 29-Oct lows marking key support in the 113-114 area. IWM has been outperforming SPY since mid October.
**************************************************************
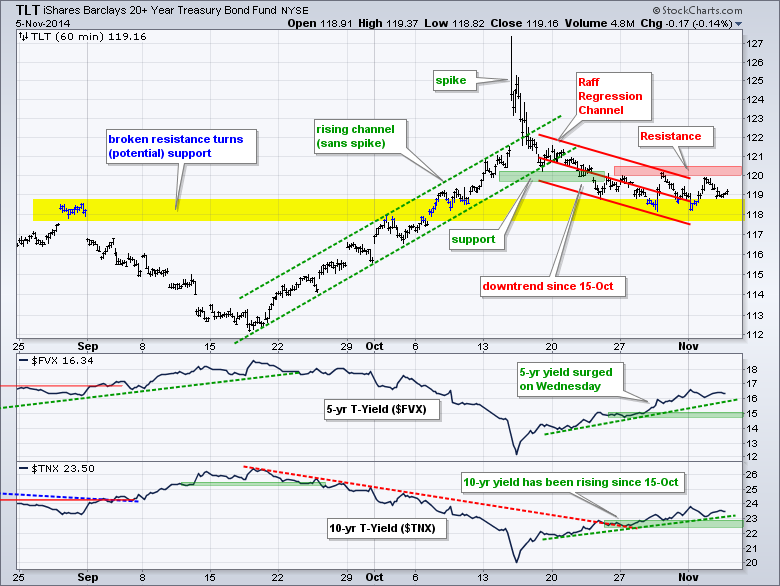
No change. The 20+ YR T-Bond ETF (TLT) remains in a short-term downtrend with the Raff Regression Channel and late October highs marking resistance in the 120-120.5 area. The 5-year Treasury Yield ($FVX) is in an uptrend with support around 1.5% (15) and the 10-YR Treasury Yield ($TNX) is in an uptrend with support around 2.25% (22.5).
**************************************************************
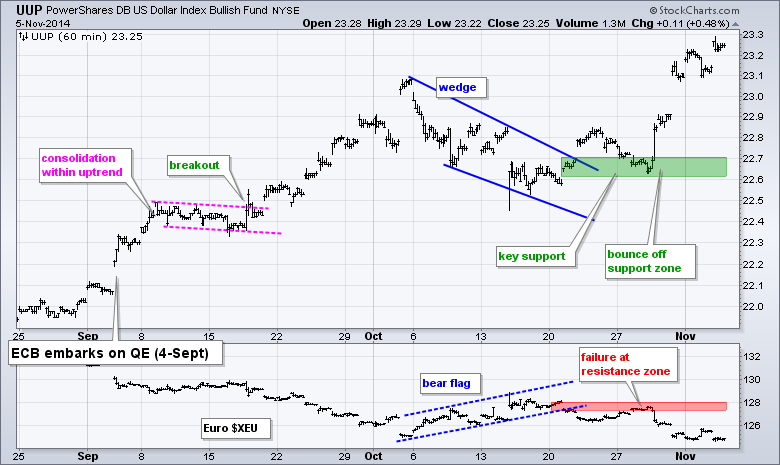
The Dollar surged to a new high as both the Euro and the Yen fell. The European Central Bank (ECB) meets today and this could affect the Euro. The Bank of Japan has given the ECB every reason for quantitative easing because the Euro is actually appreciating versus the Yen. The US is stopping QE and this is bullish for the Dollar.
**************************************************************
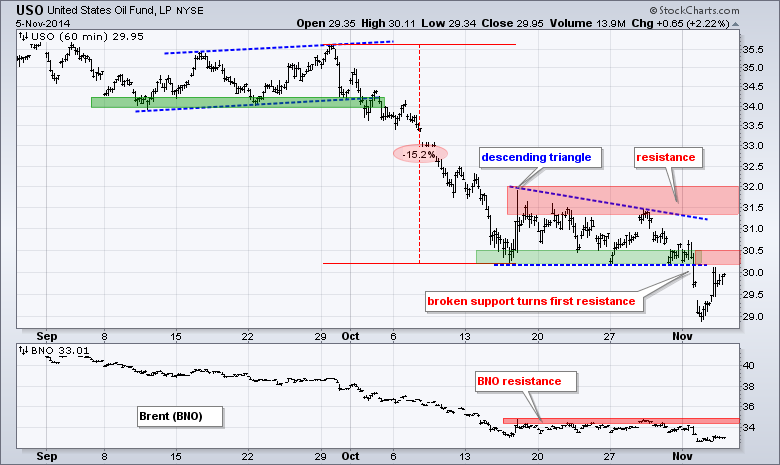
The USO Oil Fund (USO) broke support and bounced back to broken support on Wednesday. Broken support turns first resistance to watch here. While a move back above the support break would be positive, I would not turn bullish because this is a minor resistance level and the bigger downtrend still dominates. A break above the 32 would be deemed short-term bullish and argue for a retracement of the October-November decline.
**************************************************************
Gold continued its free fall as the Gold SPDR (GLD) moved below 110 for the first time since March 2010. Gold is even more oversold after this decline, but oversold conditions are secondary to the underlying trend, which is clearly down. I have no idea where to mark resistance - or support for that matter.
***************************************************************
Key Reports and Events (all times Eastern):
Thu - Nov 06 - 07:30 - Challenger Jobs Report
Thu - Nov 06 - 08:30 - Initial Jobless Claims
Thu - Nov 06 - 10:30 - Nat Gas Inventories
Fri - Nov 07 - 08:30 - Employment Report
Charts of Interest are on Tuesdays and Thursdays.
This commentary and charts-of-interest are designed to stimulate thinking. This analysis is not a recommendation to buy, sell, hold or sell short any security (stock ETF or otherwise). We all need to think for ourselves when it comes to trading our own accounts. First, it is the only way to really learn. Second, we are the only ones responsible for our decisions. Think of these charts as food for further analysis. Before making a trade, it is important to have a plan. Plan the trade and trade the plan. Among other things, this includes setting a trigger level, a target area and a stop-loss level. It is also important to plan for three possible price movements: advance, decline or sideways. Have a plan for all three scenarios BEFORE making the trade. Consider possible holding times. And finally, look at overall market conditions and sector/industry performance.

About the author:
Arthur Hill, CMT, is the Chief Technical Strategist at TrendInvestorPro.com. Focusing predominantly on US equities and ETFs, his systematic approach of identifying trend, finding signals within the trend, and setting key price levels has made him an esteemed market technician. Arthur has written articles for numerous financial publications including Barrons and Stocks & Commodities Magazine. In addition to his Chartered Market Technician (CMT) designation, he holds an MBA from the Cass Business School at City University in London.
Learn More


