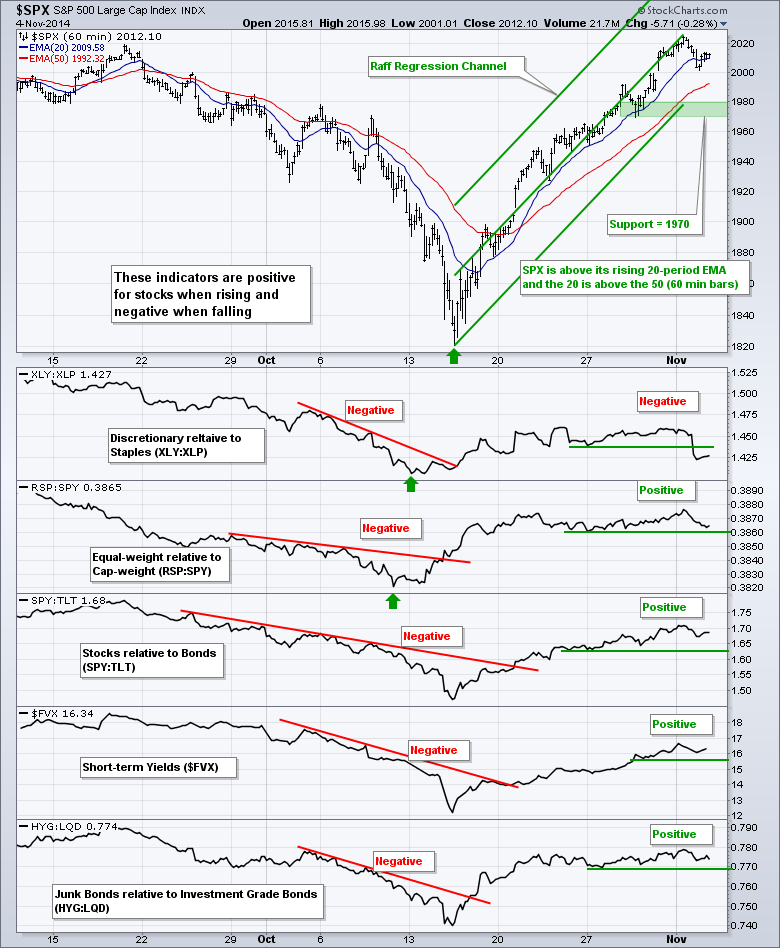
Stocks were hit with pockets of selling pressure on Tuesday. The consumer discretionary, energy and materials sectors led the way lower. Consumer staples, financials and healthcare held up relatively well. Relative weakness in the consumer discretionary sector caused the XLY:XLP ratio to break down and turn negative for stocks overall. Notice that I have re-labeled the indicators to reflect their positive or negative influence on the broader market. These are just indicators and should be used in conjunction with other analysis techniques. Overall, the majority of indicators are positive for stocks and more warnings are needed before becoming concerned. The RSP:SPY ratio, the SPY:TLT ratio, the 5-year Treasury Yield and the HYG:LQD ratio all remain positive for stocks right now. The trouble starts when three of the five turn negative. And finally, the S&P 500 remains in a clear uptrend with key support marked in the 1970-1980 area.
**This chart analysis is for educational purposes only, and should not
be construed as a recommendation to buy, sell or sell-short said securities**
**************************************************************
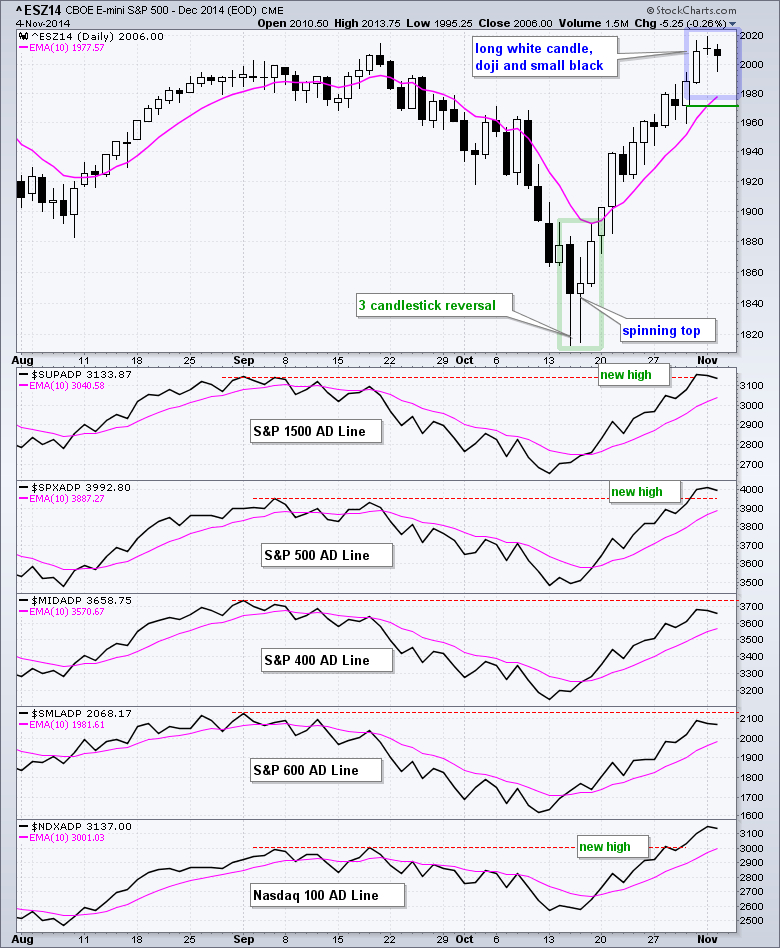
The chart below shows the December E-mini Futures Contract, which I think is a good instrument for candlestick analysis. Over the last three days, there is a long white candlestick and close above 2000 on Friday, a doji on Monday and a small decline on Tuesday. A short-term candlestick reversal pattern is possible, but only if we see a long black candlestick for confirmation. The indicator windows show the AD Lines for the S&P 1500, S&P 500 and Nasdaq 100 hitting new highs. All five AD Lines are above their rising 10-day EMAs and in short-term uptrends. These indicators may be extended after sharp advances the last three weeks, but they are still pointing up and still bullish overall.
Overview:
SPY, QQQ and IWM remain in clear uptrends and I raised key support.
UUP hit a new high on Monday and remains in an uptrend.
TLT remains in a slight downtrend with the employment report on Friday.
USO broke descending triangle support and this break is holding.
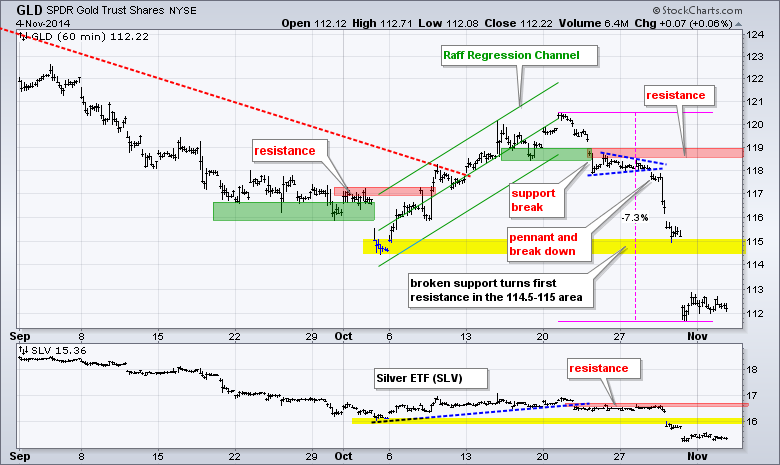
GLD is oversold and firming, but the overall trend remains down.
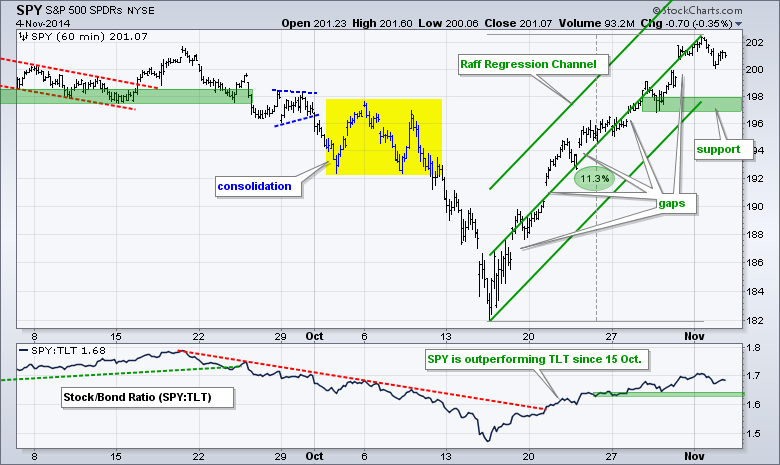
SPY remains in an uptrend with the Raff Regression Channel and 29-Oct low marking key support in the 197-198 area. Keep in mind that the Raff Regression Channel extends from the closing low to the close high of the current move. This is why it stops at Monday's high. I will extend the channel if SPY moves above this high.
**************************************************************
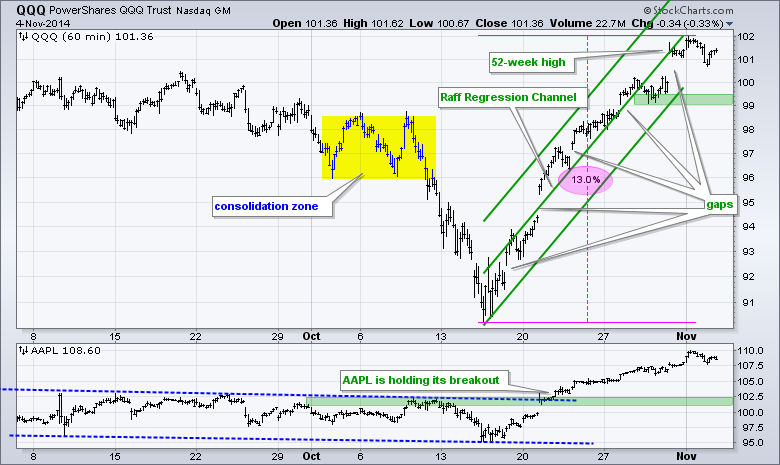
QQQ remains in an uptrend with the Raff Regression Channel and 29-Oct low marking key support in the 99-99.5 area.
**************************************************************
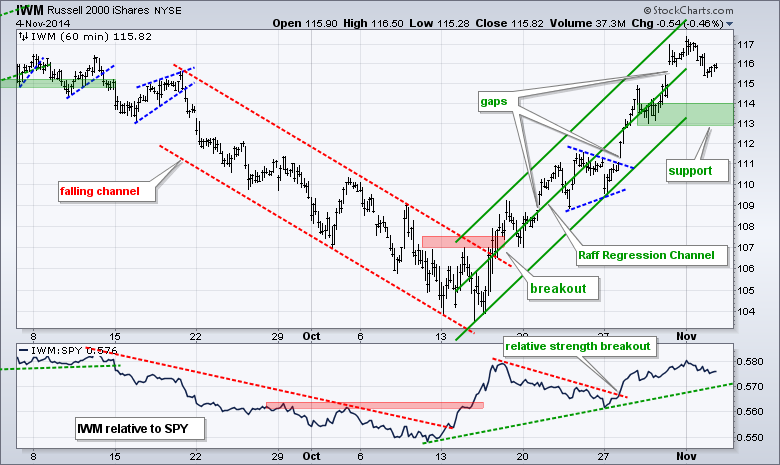
IWM remains in an uptrend with the Raff Regression Channel and 29-Oct lows marking key support in the 113-114 area. IWM has been outperforming SPY since mid October.
**************************************************************
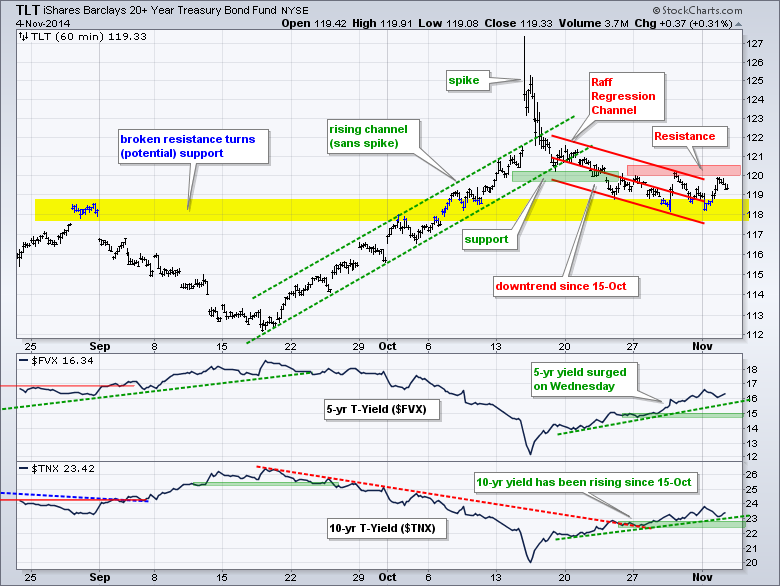
The 20+ YR T-Bond ETF (TLT) remains in a short-term downtrend with the Raff Regression Channel and late October highs marking resistance in the 120-120.5 area. The 5-year Treasury Yield ($FVX) is in an uptrend with support around 1.5% (15) and the 10-YR Treasury Yield ($TNX) is in an uptrend with support around 2.25% (22.5).
**************************************************************
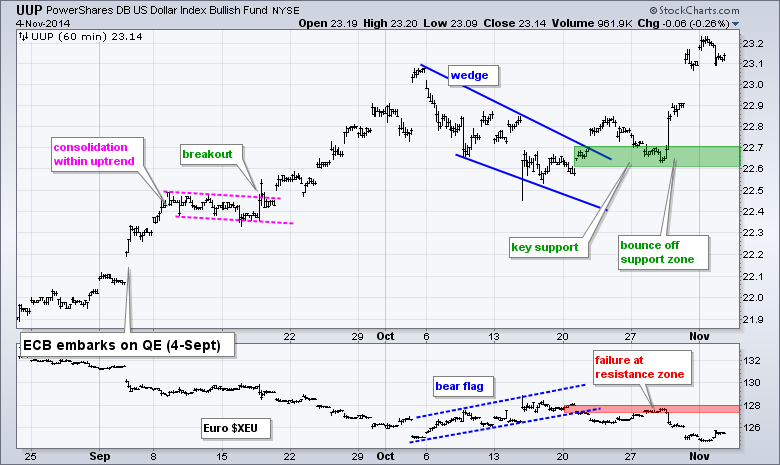
No change. The Dollar surged as the Yen and Euro plunged on Friday. The US Dollar ETF (UUP) hit a new high to affirm the uptrend and support in the 22.6-22.7 area. As with stocks, the Dollar may be short-term overbought, but the clear uptrend carries more weight than overbought conditions. The Euro Index ($XEU) is trading near its October low with resistance at 128.
**************************************************************
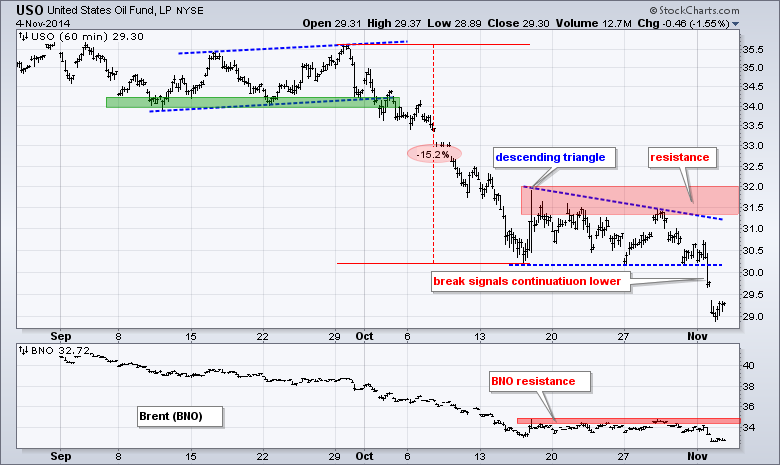
No change. The USO Oil Fund (USO) fell 15% and then formed a descending triangle over the last few weeks. With a sharp decline on Monday afternoon, USO broke support to signal a continuation of the prior decline. This means oil could fall another 5%. The indicator window shows the US Brent Oil ETF (BNO) failing at resistance in the 35 area.
**************************************************************
No change. Gold is as oversold as the Dollar is overbought, but the Gold SPDR (GLD) remains in a clear downtrend and any bounce would be deemed a counter-trend move. GLD fell over 7% in less than two weeks and broke below the early October low. This broken support level turns first resistance. I will leave key resistance in the 118.5-119 area for now.
***************************************************************
Key Reports and Events (all times Eastern):
Wed - Nov 05 - 07:00 - MBA Mortgage Index
Wed - Nov 05 - 08:15 - ADP Employment Report
Wed - Nov 05 - 10:00 - ISM Services
Wed - Nov 05 - 10:30 - Crude Oil Inventories
Thu - Nov 06 - 07:30 - Challenger Jobs Report
Thu - Nov 06 - 08:30 - Initial Jobless Claims
Thu - Nov 06 - 10:30 - Nat Gas Inventories
Fri - Nov 07 - 08:30 - Employment Report
Charts of Interest are on Tuesdays and Thursdays.
This commentary and charts-of-interest are designed to stimulate thinking. This analysis is not a recommendation to buy, sell, hold or sell short any security (stock ETF or otherwise). We all need to think for ourselves when it comes to trading our own accounts. First, it is the only way to really learn. Second, we are the only ones responsible for our decisions. Think of these charts as food for further analysis. Before making a trade, it is important to have a plan. Plan the trade and trade the plan. Among other things, this includes setting a trigger level, a target area and a stop-loss level. It is also important to plan for three possible price movements: advance, decline or sideways. Have a plan for all three scenarios BEFORE making the trade. Consider possible holding times. And finally, look at overall market conditions and sector/industry performance.


