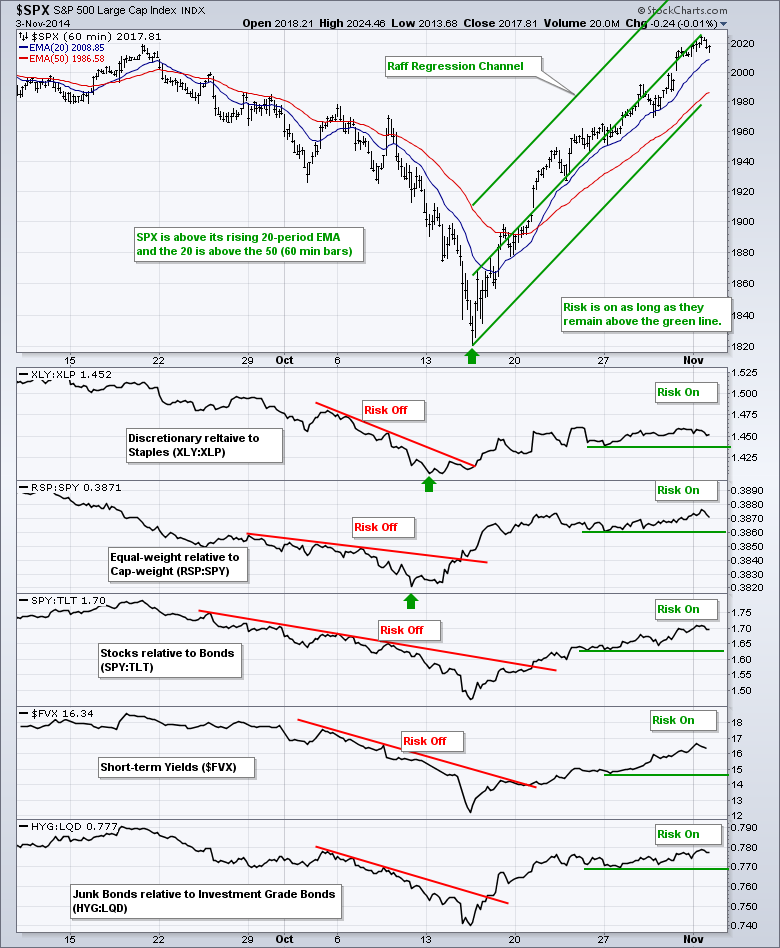
Today we will start with a short-term look at the risk on-off dynamics in the stock market right now. Note that I am only referring to the stock market. Oil, gold, the Dollar and the Euro do not fit into this equation right now. I am using five things to measure the appetite for risk in the stock market. First, there is the ratio of the Consumer Discretionary SPDR (XLY) to the Consumer Staples SPDR (XLP). Risk is on when XLY outperforms XLP. Second, there is the ratio of the Equal-Weight S&P 500 ETF (RSP) to the S&P 500 SPDR (SPY). Risk is on when RSP outperforms SPY. Third, there is the ratio of the S&P 500 SPDR (SPY) to the 20+ YR T-Bond ETF (TLT). Risk is on when stocks outperform bonds. Fourth, there is the 5-year Treasury Yield ($FVX). Risk is on when this yield rises because it means money is moving out of short-term Treasury bonds. And finally, we have the ratio of high yield corporate bonds to investment grade corporate bonds. Risk is on when junk bonds outperform. As the chart below shows, all five risk indicators turned up in mid October and are still moving higher. The green lines mark the key levels to watch for each indicator. A move below these lines would signal a down turn and favor the risk-off environment for stocks. Notice that the RSP:SPY ratio and XLY:XLP ratio turned up a few days before the S&P 500 bottomed (green arrows).
**This chart analysis is for educational purposes only, and should not
be construed as a recommendation to buy, sell or sell-short said securities**
**************************************************************
Overview:
SPY, QQQ and IWM remain in clear uptrends.
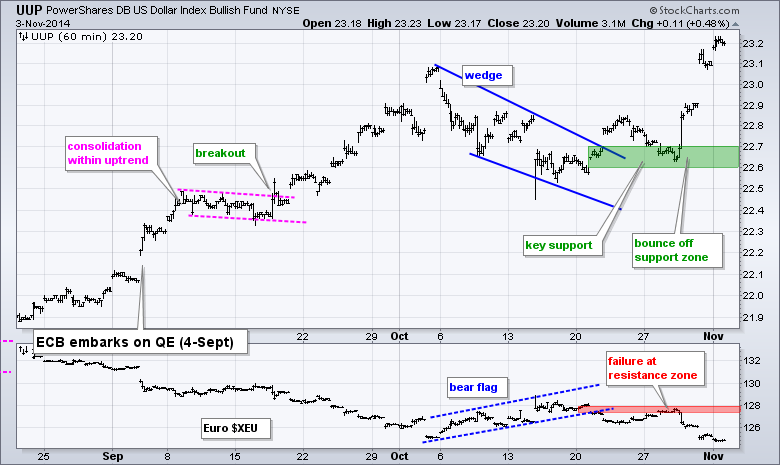
UUP hit another new high to affirm its uptrend.
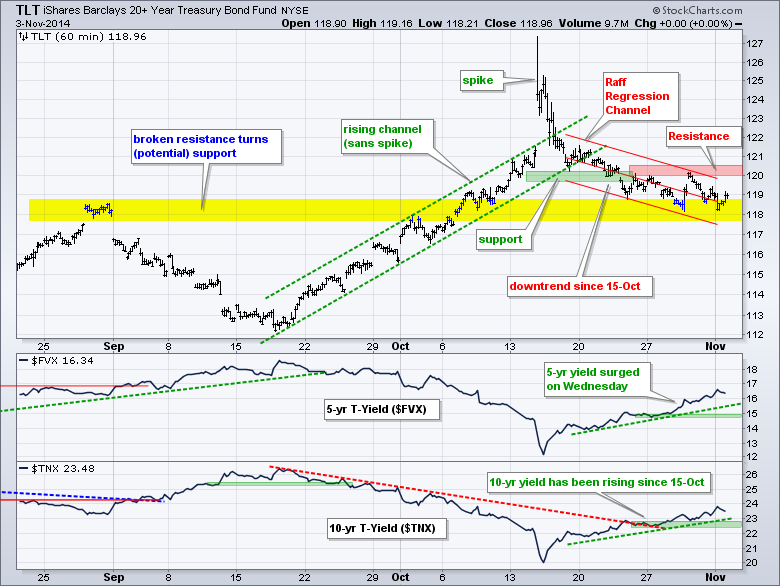
TLT extended its short-term downtrend and I lowered resistance.
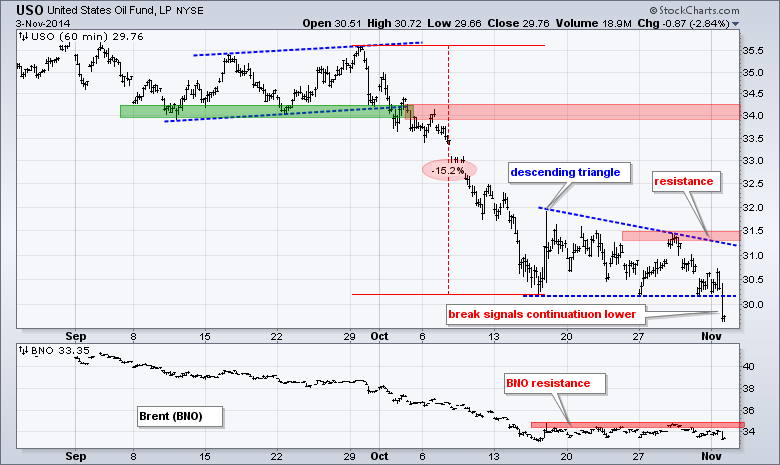
USO broke descending triangle support to signal a continuation lower.
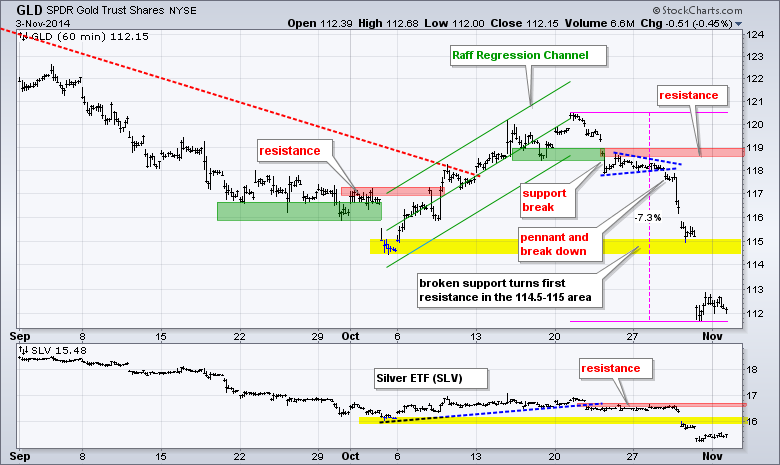
GLD is oversold, but in a short-term and long-term downtrend.
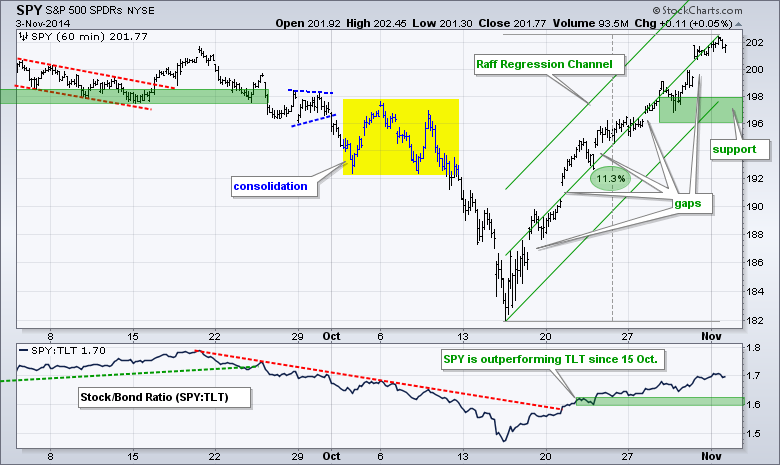
No change. SPY gapped up again on Friday and closed above the September closing high. The ETF remains in a strong uptrend that is punctuated by five gaps in the last three weeks. The Raff Regression Channel defines this uptrend with support marked at 196.
**************************************************************
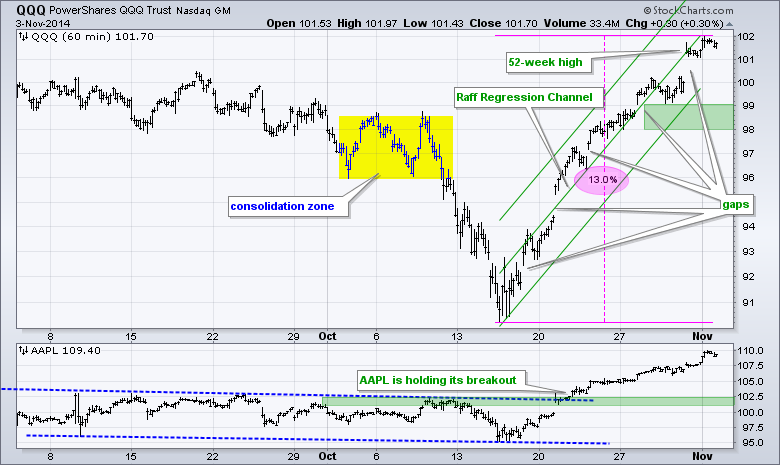
No change. QQQ gapped up and hit a 52-week high on Friday to extend the short-term uptrend. Even though the ETF is overbought after a 12 percent run in less than 3 weeks, there is no denying this uptrend. The reward-to-risk ratio and a buffer mark support in the 98-99 area.
**************************************************************
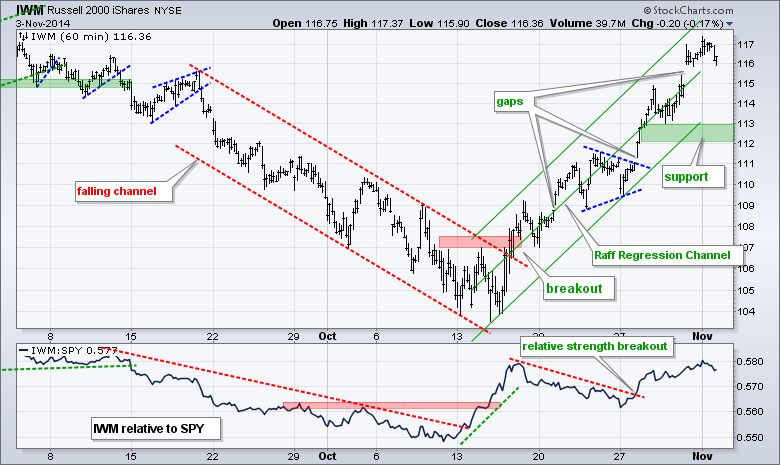
No change. IWM gapped up on Friday and closed at its highest level since early September. This marks at least the third gap in the last three weeks. The Raff Regression Channel and a buffer mark first support in the 112-113 area. The indicator window shows IWM outperforming SPY since the price relative broke out early last week.
**************************************************************
The ISM Manufacturing Index surged to 59 in October for another blow out month. The 20+ YR T-Bond ETF (TLT) opened weak, but firmed and moved back to the 119 area. The trend since mid October remains down, but the ETF is finding support near broken resistance (late August high). Even though it is an interesting juncture, signs of strength in the economy could keep Treasuries under pressure. Key resistance is set at 120.5
**************************************************************
No change. The Dollar surged as the Yen and Euro plunged on Friday. The US Dollar ETF (UUP) hit a new high to affirm the uptrend and support in the 22.6-22.7 area. As with stocks, the Dollar may be short-term overbought, but the clear uptrend carries more weight than overbought conditions. The Euro Index ($XEU) is trading near its October low with resistance at 128.
**************************************************************
The USO Oil Fund (USO) fell 15% and then formed a descending triangle over the last few weeks. With a sharp decline on Monday afternoon, USO broke support to signal a continuation of the prior decline. This means oil could fall another 5%. The indicator window shows the US Brent Oil ETF (BNO) failing at resistance in the 35 area.
**************************************************************
No change. Gold is as oversold as the Dollar is overbought, but the Gold SPDR (GLD) remains in a clear downtrend and any bounce would be deemed a counter-trend move. GLD fell over 7% in less than two weeks and broke below the early October low. This broken support level turns first resistance. I will leave key resistance in the 118.5-119 area for now.
***************************************************************
Key Reports and Events (all times Eastern):
Tue - Nov 04 - 10:00 - Factory Orders
Wed - Nov 05 - 07:00 - MBA Mortgage Index
Wed - Nov 05 - 08:15 - ADP Employment Report
Wed - Nov 05 - 10:00 - ISM Services
Wed - Nov 05 - 10:30 - Crude Oil Inventories
Thu - Nov 06 - 07:30 - Challenger Jobs Report
Thu - Nov 06 - 08:30 - Initial Jobless Claims
Thu - Nov 06 - 10:30 - Nat Gas Inventories
Fri - Nov 07 - 08:30 - Employment Report
Charts of Interest are on Tuesdays and Thursdays.
This commentary and charts-of-interest are designed to stimulate thinking. This analysis is not a recommendation to buy, sell, hold or sell short any security (stock ETF or otherwise). We all need to think for ourselves when it comes to trading our own accounts. First, it is the only way to really learn. Second, we are the only ones responsible for our decisions. Think of these charts as food for further analysis. Before making a trade, it is important to have a plan. Plan the trade and trade the plan. Among other things, this includes setting a trigger level, a target area and a stop-loss level. It is also important to plan for three possible price movements: advance, decline or sideways. Have a plan for all three scenarios BEFORE making the trade. Consider possible holding times. And finally, look at overall market conditions and sector/industry performance.


