Stocks were mostly lower on Monday with small-caps and mid-caps leading the decline. Large-caps held up relatively well with SPY losing just .69% on the day. Retail stocks suffered a black Friday hangover as the Retail SPDR (XRT) fell over 2%. The ETF, however, was up some 15% from its mid October low and hit a 52-week high on Friday. As with stocks in general, XRT is certainly entitled to some profit taking after the big run up. At this point, selling pressure could be confined to profit taking and dips may entice the under-invested to enter the market. The major index ETFs are, after all, in long-term uptrends and the bulls still have the edge overall.
**This chart analysis is for educational purposes only, and should not
be construed as a recommendation to buy, sell or sell-short said securities**
Short-term Overview (Tuesday, 2-December-2014):
- There are some negatives out there, but the majority of indicators are still positive for stocks.
- Four of the five AD Lines are in uptrends (the small-cap AD Line is the only negative).
- The three bond-related indicators suggest risk-off, but the two stock-specific indicators are still risk-on.
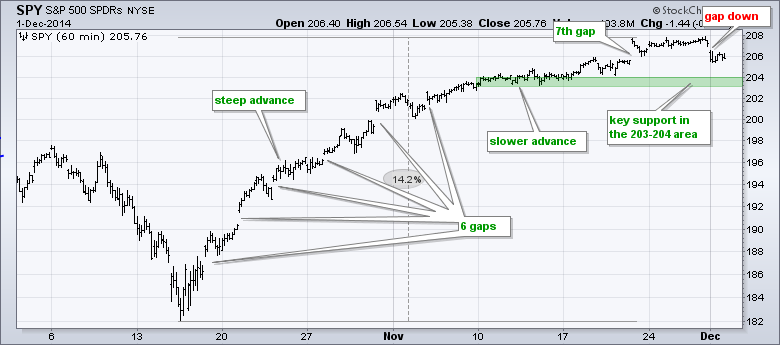
- SPY fell less than 1% over the last two days and remains in a short-term uptrend with support in the 203-204 area.
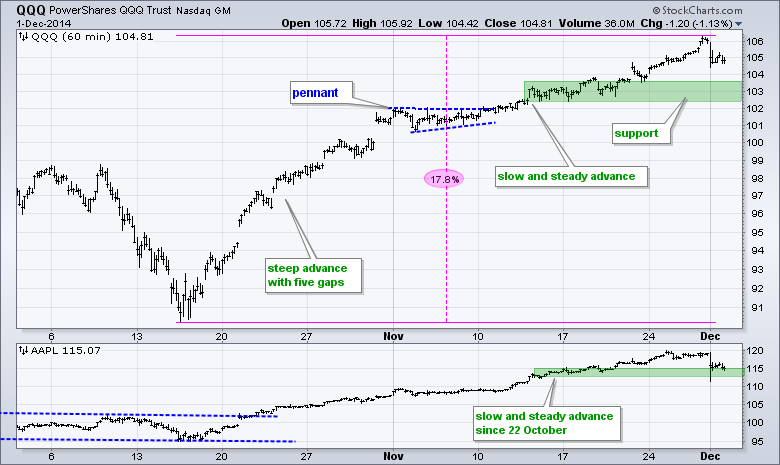
- QQQ suffered its worst decline (-.67%) since mid October, but remains in an uptrend with support in the 102.5-103.5 area.
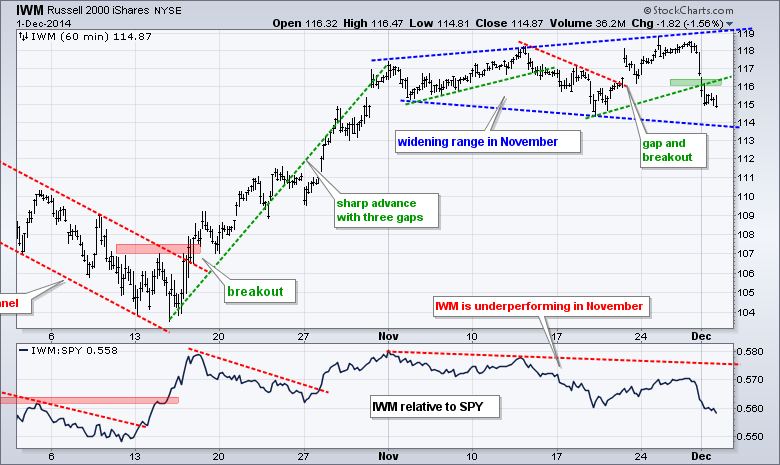
- IWM fell 3% the last two days and broke upswing support at 116 on 1-Dec.
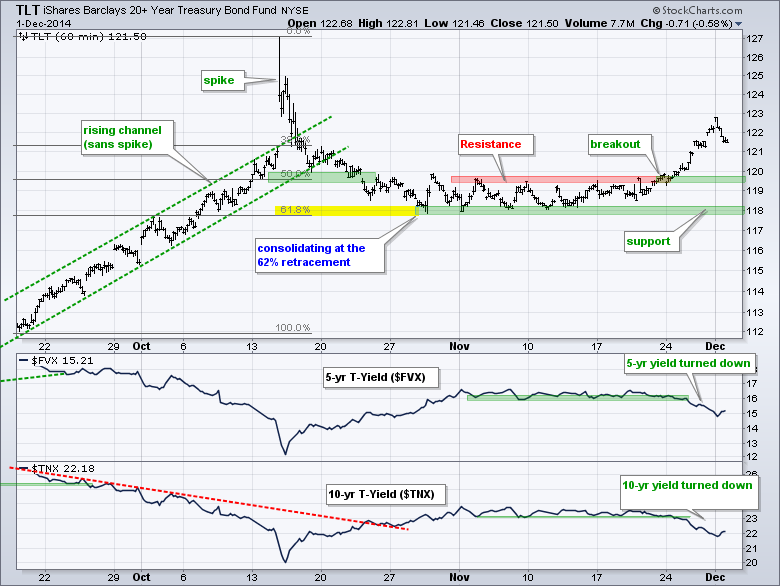
- TLT broke out at 120 on 21-Nov and key support remains at 118.
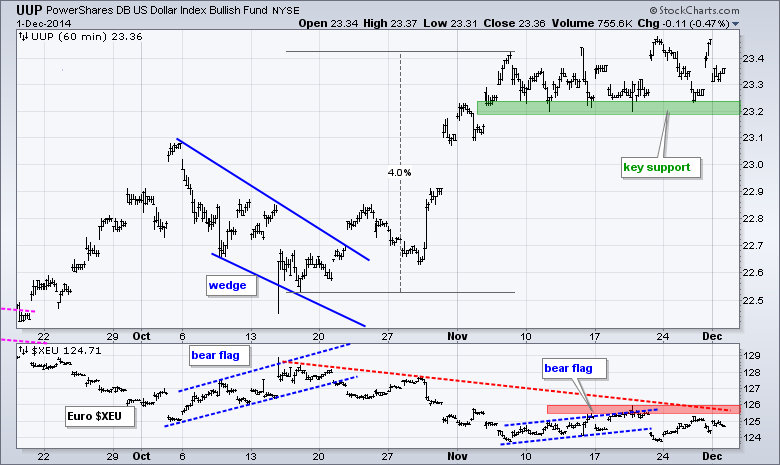
- UUP bounced off support to extend its uptrend and the Euro failed at resistance.
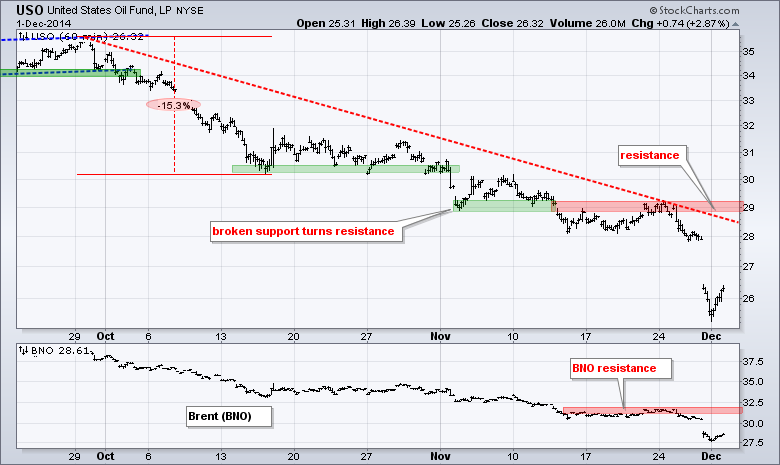
- USO got an oversold bounce on Monday, but remains in a clear downtrend.
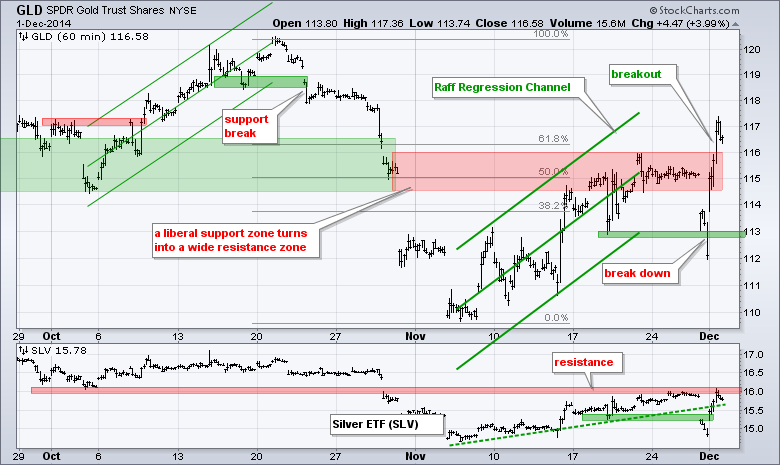
- GLD reversed its reversal with a surge above resistance, but remains way too erratic for my taste.
The December E-mini S&P 500 (^ESZ14) closed below the lower band of the 3-day price channel, which means it closed below the low of the prior three days. This is the first close below the lower band since October 17th, a 29-day streak. Despite the biggest 1-day decline since October 22nd, the overall trend is still up and I am marking key support in the 2020-2040 area. The big trend is up and pullbacks are deemed mere corrections within this uptrend.
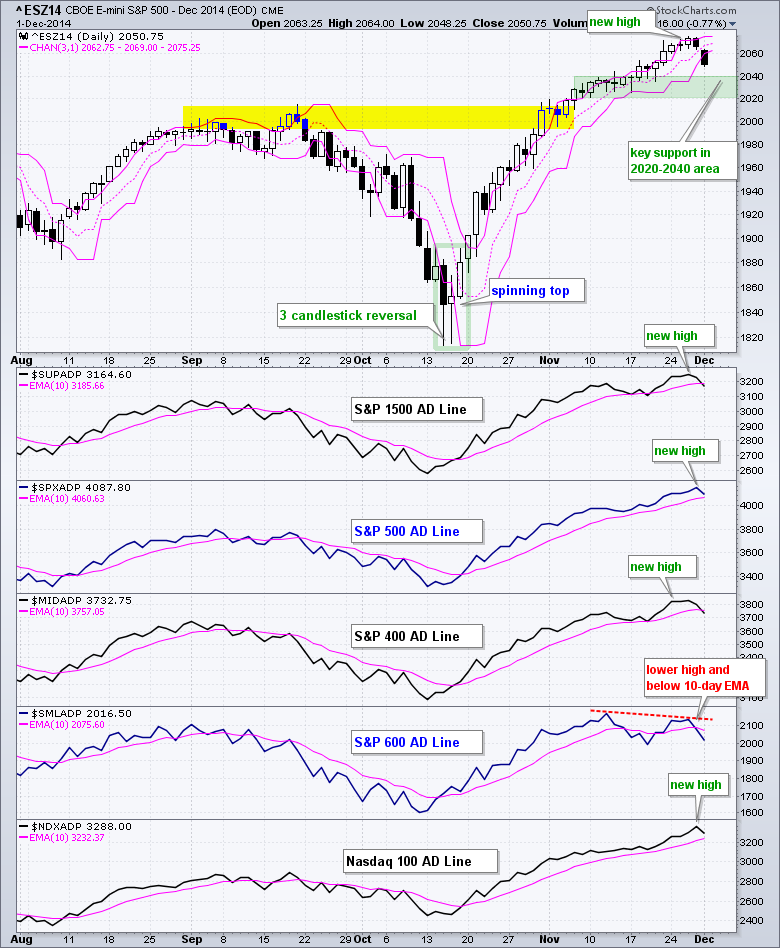
Three of the five AD Lines are below their 10-day EMAs, but I think four of the five are still in uptrends. The S&P 500 and Nasdaq 100 AD Lines are the strongest of the group. The S&P MidCap 400 AD Line and S&P 1500 AD Line moved below their 10-day EMAs today, while the S&P Small-Cap 600 AD Line formed a bearish divergence and moved below its 10-day EMA.
There is no change for the risk indicators. The two stock-specific indicators are positive and the three bond-related indicators are negative. While I am concerned with strength in Treasury bonds and relative weakness in junk bonds, this is still more of a bond issue than a stock issue. Concern would turn to bearishness if the two stock-specific indicators turned bearish (consumer discretionary sector starts underperforming the consumer staples sector and the Equal-Weight S&P 500 ETF (RSP) starts underperforming the S&P 500 SPDR (SPY))

The S&P 500 SPDR (SPY) gapped up for the seventh time on 21-Nov, stalled and then gapped down on Monday. The 21-Nov gap has been filled and Monday's gap held. While this is negative, it is not enough to reverse the slow uptrend that began in November. Again, I think the bigger trend is up and this means I am looking for a place to bounce, not a place to break. Key support remains in the 203-204 area.
**************************************************************
QQQ fell sharply as Apple weighed with a 3+ percent decline. This decline, however, is not enough to alter the November advance. Even though another shoe could drop, I would expect support and a bounce in the 102.5-103.5 area. The mid November consolidation marks support here. Note that Apple is already at the upper end of its support zone.
**************************************************************
IWM reversed its upswing with a sharp decline below 116. Even though IWM is now in a down swing, the stock market overall is in an uptrend and IWM has a habit of bouncing right after a sharp decline. It is also possible that the November lows mark support. A quick move back above 116.5 would negate this support break. The indicator window shows IWM underperforming SPY.
**************************************************************
No change. The 20+ YR T-Bond ETF (TLT) broke out on November 21st and continued higher last week. The plunge in energy prices is keeping inflation in check and this is bullish for bonds. On the price chart, TLT broke a long consolidation with the move above 120 and this breakout held. Broken resistance turns first support and I am leaving key support at 118 for now. The indicator windows show Treasury yields moving lower.
**************************************************************
No change. The US Dollar ETF (UUP) fell back to support on Wednesday, but then surged as oil moved sharply lower. Even though it seems counterintuitive, it appears as if the plunge in oil boosted the greenback. On the price chart, UUP surged off support and ended the week near its high of the month. Key support is set in the 23.3 area. The indicator window shows the Euro Index ($XEU) breaking flag support and the flag high turning into resistance in the 126 area.
**************************************************************
No change. The USO Oil Fund (USO) firmed for over a week and then plunged to new lows after the OPEC meeting. It is basically a supply issue because OPEC kept its quotas, fracking continues and Iran may even increase production in the coming months if talks progress. USO is once again oversold, but still in a clear downtrend with resistance marked in the 29 area.
**************************************************************
No clue. Those two words sum up my feelings on gold.
***************************************************************
Key Reports and Events (all times Eastern):
Tue - Dec 02 - 10:00 - Construction Spending
Tue - Dec 02 - 14:00 - Auto-Truck Sales
Wed - Dec 03 - 07:00 - MBA Mortgage Index
Wed - Dec 03 - 08:15 - ADP Employment Report
Wed - Dec 03 - 10:00 - ISM Services Index
Wed - Dec 03 - 10:30 - Crude Oil Inventories
Wed - Dec 03 - 14:00 - Fed's Beige Book
Thu - Dec 04 - 07:30 - Challenger Job Report
Thu - Dec 04 - 08:30 - Initial Jobless Claims
Thu - Dec 04 - 10:30 - Natural Gas Inventories
Fri - Dec 05 - 08:30 - Employment Report
Fri - Dec 05 - 10:00 - Factory Orders
Fri - Dec 05 - 15:00 - Consumer Credit
Charts of Interest are on Tuesdays and Thursdays.
This commentary and charts-of-interest are designed to stimulate thinking. This analysis is not a recommendation to buy, sell, hold or sell short any security (stock ETF or otherwise). We all need to think for ourselves when it comes to trading our own accounts. First, it is the only way to really learn. Second, we are the only ones responsible for our decisions. Think of these charts as food for further analysis. Before making a trade, it is important to have a plan. Plan the trade and trade the plan. Among other things, this includes setting a trigger level, a target area and a stop-loss level. It is also important to plan for three possible price movements: advance, decline or sideways. Have a plan for all three scenarios BEFORE making the trade. Consider possible holding times. And finally, look at overall market conditions and sector/industry performance.


