The S&P 500 is less than 6% from its all time high and the Nasdaq 100 is less than 7% below its all time high. While the December decline looks dramatic on its own and the short-term trend is down, keep in mind that the major index ETFs surged double digits from mid October until late November and were entitled to a pullback. At this point, the market has been hit with a shock to the system. That shock, of course, is the 50% plunge in oil prices in less than 7 months. The market is currently trying to digest this shock and weigh the consequences. While the decline in oil is beneficial to consumers and energy costs for companies, it is negative for energy-sensitive bond issuers and stocks. Regardless of oil, Russia, Greece, Europe, the Santa Claus rally and the VIX, the charts for $SPX and $NDX indicate that the bigger trend is up and this is a correction within that uptrend.
**This chart analysis is for educational purposes only, and should not
be construed as a recommendation to buy, sell or sell-short said securities**
Short-term Overview (Wednesday, 17-December-2014):
- All five AD Lines are below their 10-day EMAs and three are below their mid November lows.
- The three bond-related risk indicators are negative, but the two stock specific indicators are positive.
- SPY extended its short-term downtrend and resistance is marked at 203.
- QQQ extended its short-term downtrend and resistance is marked at 103.
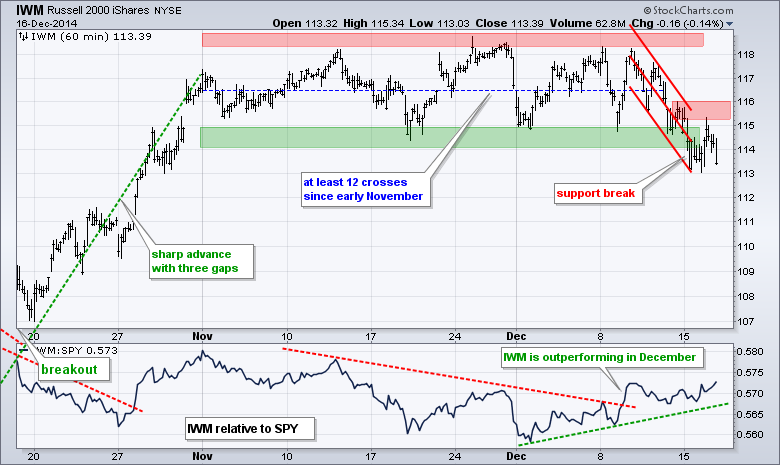
- IWM is holding up better than SPY, but still in a downswing with resistance at 116.
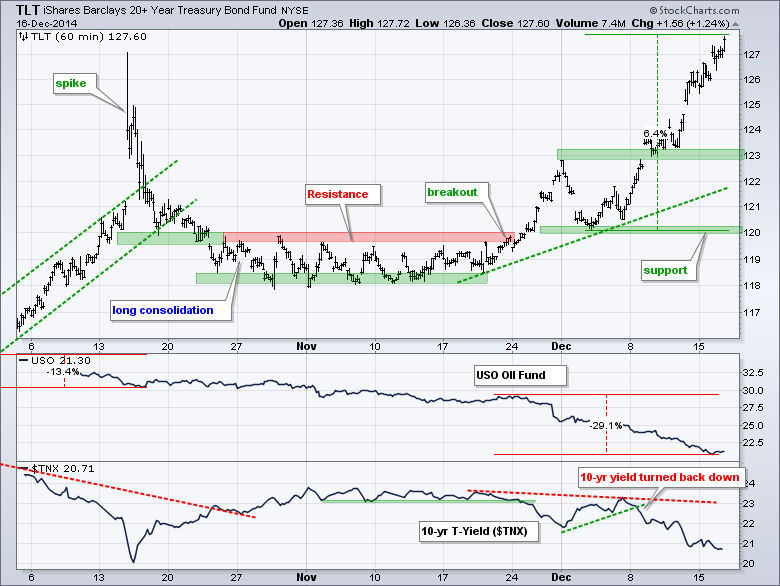
- TLT surged above its mid October high and support is set at 120.
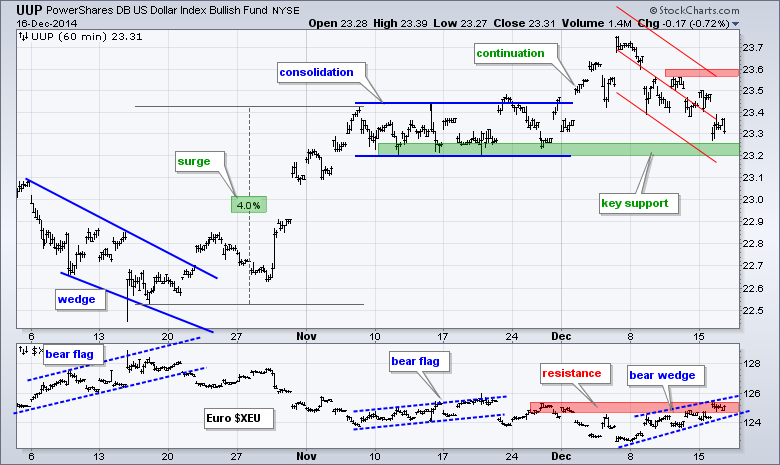
- UUP fell back and the Euro bounced, but the Euro is nearing resistance.
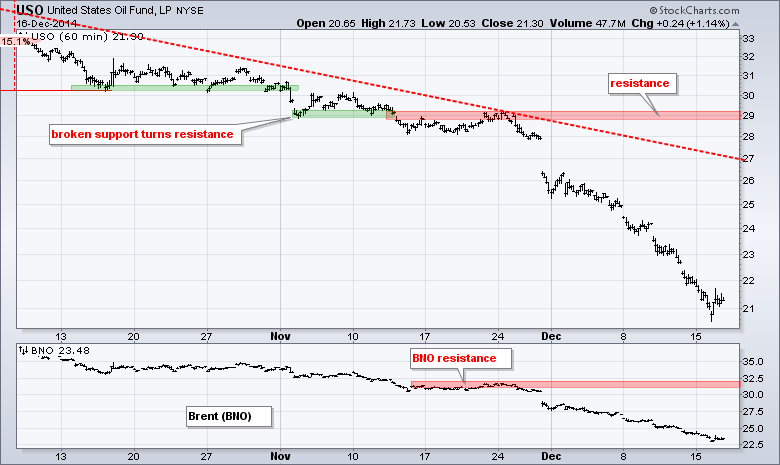
- USO remains in a strong downtrend.
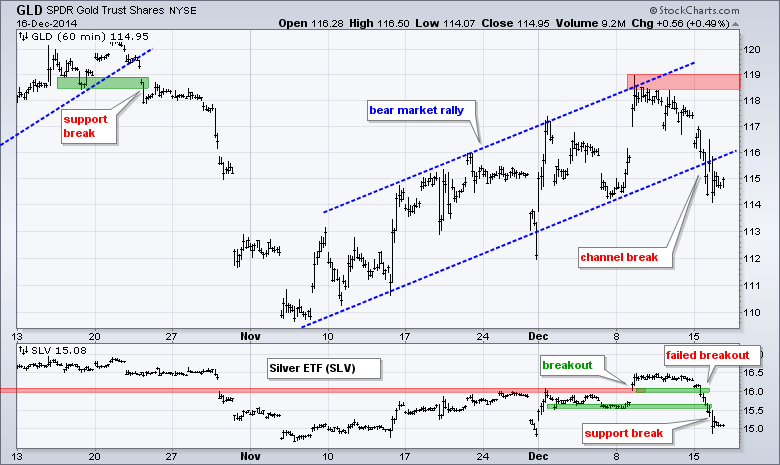
- GLD broke channel support with a sharp decline and this signals a continuation of the long-term downtrend.
The December E-mini S&P 500 (^ESZ14) surged to the 2020 area twice in the last two days, but failed to hold early gains and closed near the low. The highs of the last two days and the Raff Regression Channel mark short-term resistance at 2020 and this is the level to beat for a short-term trend reversal.
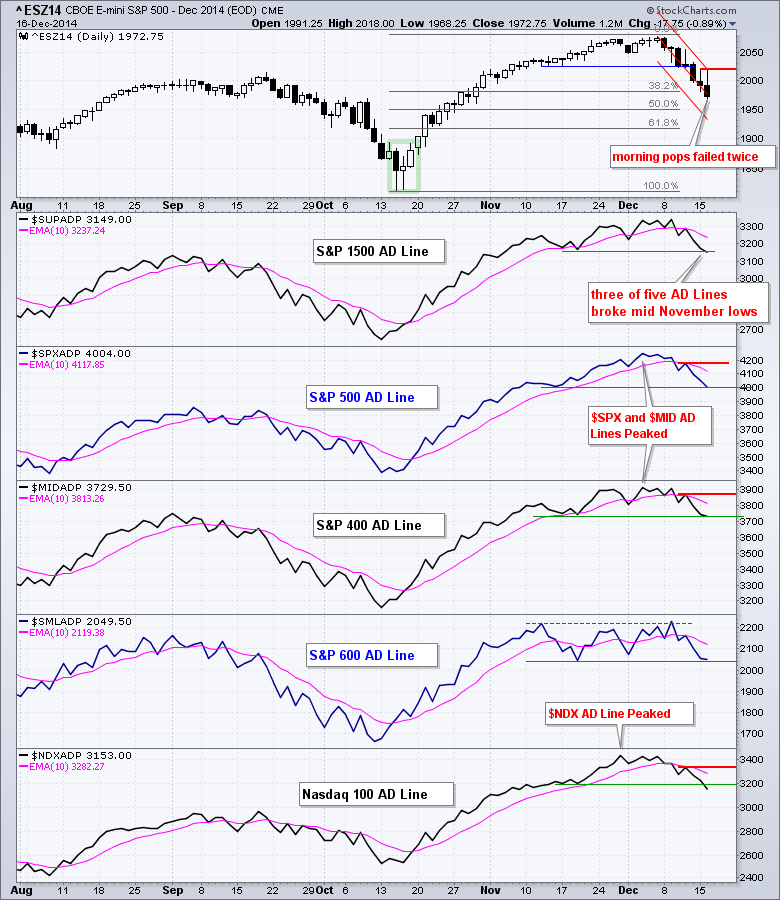
Three of the five AD Lines broke below their mid November lows (green lines). The AD Lines for the S&P 1500, S&P MidCap 400 and Nasdaq 100 broke these lows, while the AD Lines for the S&P 500 and S&P Small-Cap 600 are right at these lows. With all five below their 10-day EMAs and three breaking key lows, short-term breadth is negative.
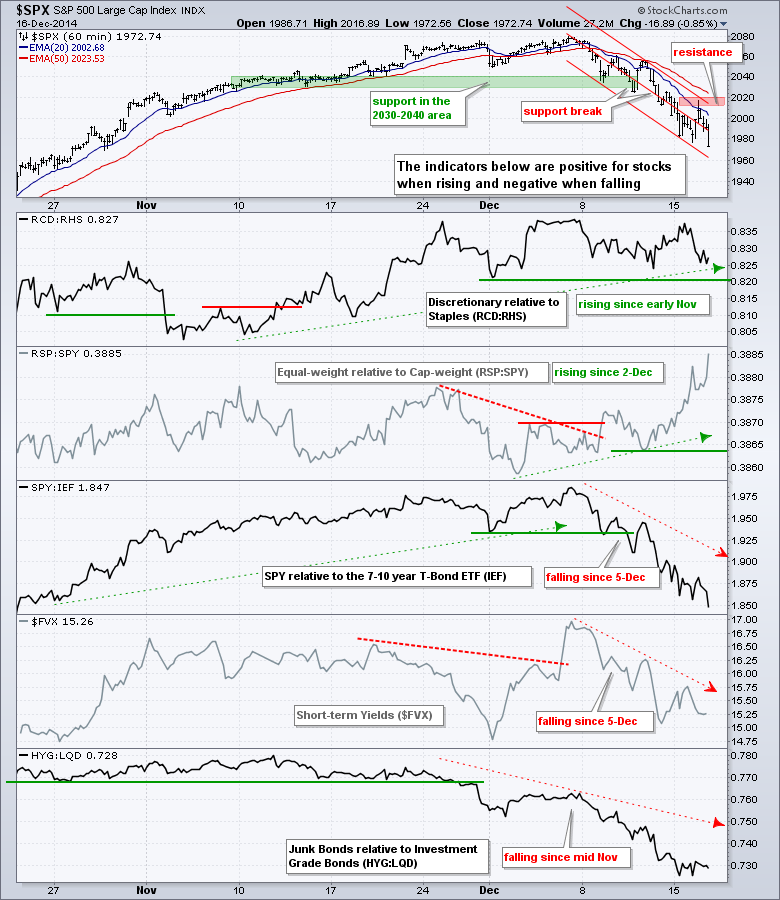
The song remains the same. The credit markets are strained because junk bonds are seriously underperforming investment grade corporate bonds and SPY is underperforming the 7-10 YR T-Bond ETF (IEF). I switched from TLT to IEF because IEF tracks the benchmark 10-year T-Note, which sets the benchmark 10-YR Treasury Yield ($UST10Y). The two stock-related indicators are positive. Note that the Equal-Weight S&P 500 ETF (RSP) has really started to outperform SPY the last few days.
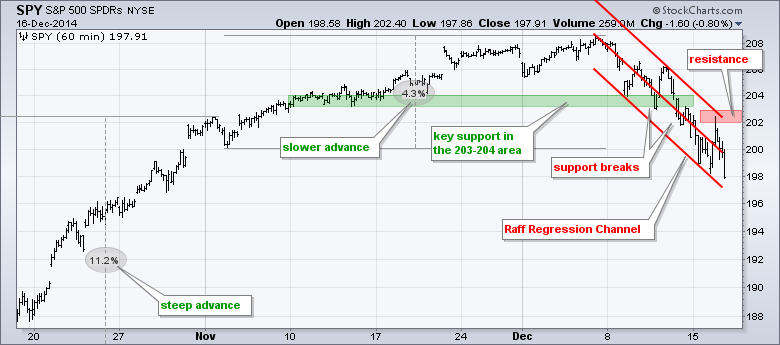
SPY broke support in the 203-204 area last week, continued lower this week and closed at its lowest level since late October. Trading has turned quite volatile the last two days as SPY moved above 202 twice and twice closed below 200. The Monday-Tuesday highs and the Raff Regression Channel can be used to mark resistance at 202-203.
**************************************************************
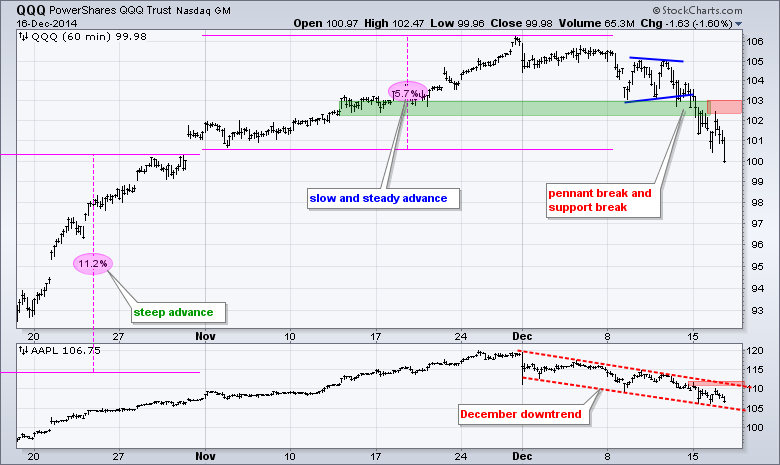
QQQ broke pennant support on Friday, broke the support zone on Monday and closed at 100 on Tuesday, which is the lowest level since late October. Broken support turns into first resistance in the 102.5-103 area. Apple remains in a December downtrend with a series of lower lows and lower highs. A break above 112 is needed to reverse this slide.
**************************************************************
No change. IWM is still holding up better than SPY, but the ETF broke support with a move below 114 on Monday. A short Raff Regression Channel marks the current downswing with resistance set at 116
**************************************************************
No change. Oil is down around 25+ percent the last three weeks and the 20+ YR T-Bond ETF (TLT) is up around 5.5% in two weeks. The decline in oil also weighed on the junk bond market. Treasury bonds are benefitting from lower expectations for inflation and a flight to safety in the bond market. On the TLT chart, broken resistance turns first support in the 123 area. Key support remains in the 120 area for now.
**************************************************************
No change. The US Dollar ETF (UUP) fell back last week, but the bigger trend is up and this is viewed as a correction. A break above 23.60 would signal a continuation higher. The Euro Index ($XEU) bounced last week and formed a rising wedge, which looks like a bear market rally. A break below 124 would signal a continuation lower.
**************************************************************
No change. The USO Oil Fund (USO) remains in a strong downtrend.
**************************************************************
No change. The Gold SPDR (GLD) had a flag working last week and had every chance to breakout, but did not and moved sharply lower on Monday. This move broke the lower trend line of a rising channel and erased last week's surge. With the bigger trend down, this looks like a continuation breakdown and a move to new lows is expected.
***************************************************************
Key Reports and Events (all times Eastern):
Wed - Dec 17 - 07:00 - MBA Mortgage Index
Wed - Dec 17 - 08:30 - Consumer Price Index (CPI)
Wed - Dec 17 - 10:30 - Crude Oil Inventories
Wed - Dec 17 - 14:00 - FOMC Policy Statement
Thu - Dec 18 - 08:30 - Initial Jobless Claims
Thu - Dec 18 - 10:00 - Philadelphia Fed
Thu - Dec 18 - 10:00 - Leading Economic Indicators
Thu - Dec 18 - 10:30 - Natural Gas Inventories
Charts of Interest are on Tuesdays and Thursdays.
This commentary and charts-of-interest are designed to stimulate thinking. This analysis is not a recommendation to buy, sell, hold or sell short any security (stock ETF or otherwise). We all need to think for ourselves when it comes to trading our own accounts. First, it is the only way to really learn. Second, we are the only ones responsible for our decisions. Think of these charts as food for further analysis. Before making a trade, it is important to have a plan. Plan the trade and trade the plan. Among other things, this includes setting a trigger level, a target area and a stop-loss level. It is also important to plan for three possible price movements: advance, decline or sideways. Have a plan for all three scenarios BEFORE making the trade. Consider possible holding times. And finally, look at overall market conditions and sector/industry performance.


