Stocks moved lower on Monday with small-caps and energy shares leading the way. The Russell 2000 iShares (IWM) declined over 1% and the SmallCap Energy ETF (PSCE) declined over 7%. Even though the energy sector accounts for just 3.5% of IWM, an oversize decline like 7.6% will definitely have an impact. Financials bucked the selling pressure as the Finance SPDR (XLF) and the Equal-weight Finance ETF (RYF) gained. Utilities were also strong as money moved into this defensive sector. As detailed below, signs of risk aversion are creeping into the market and this could give way to a correction in the major index ETFs, which are still up significantly since mid October. The short-term trends remain up and I am watching support levels in SPY and QQQ for areas that may mark the near-term low and produce a reversal.
**This chart analysis is for educational purposes only, and should not
be construed as a recommendation to buy, sell or sell-short said securities**
Short-term Overview (Tuesday, 8-December-2014):
- Breadth is positive and the trends are up, but three risk indicators are negative.
- Four of the five AD Lines are in uptrends, but a series of progressive peaks formed the last few weeks.
- Money continues to move into long-term Treasury bonds and this shows risk aversion.
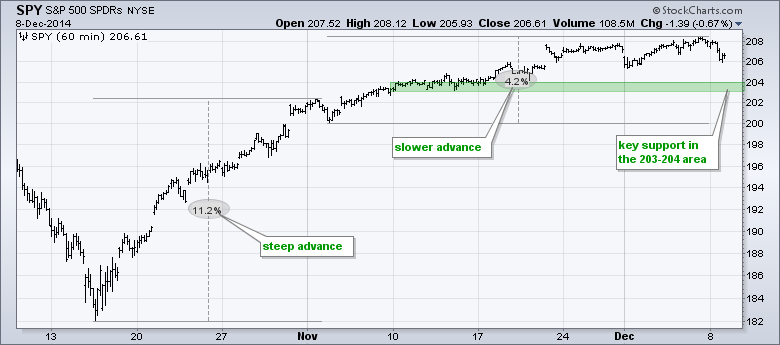
- SPY remains in a short-term uptrend with support in the 203-204 area.
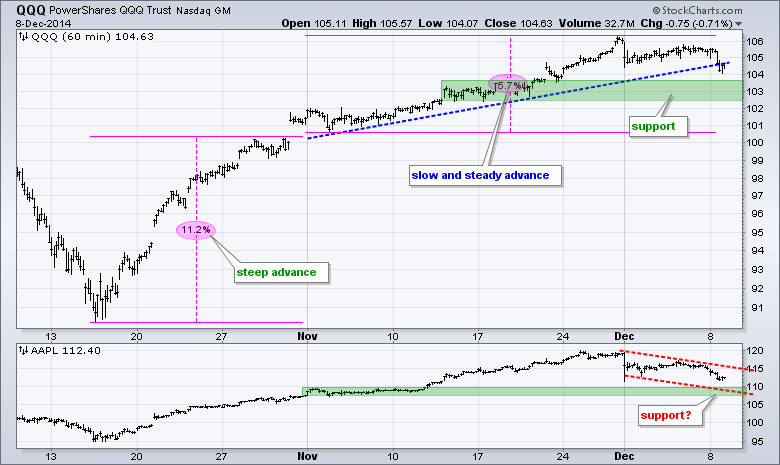
- QQQ remains in an uptrend with support in the 102.5-103.5 area.
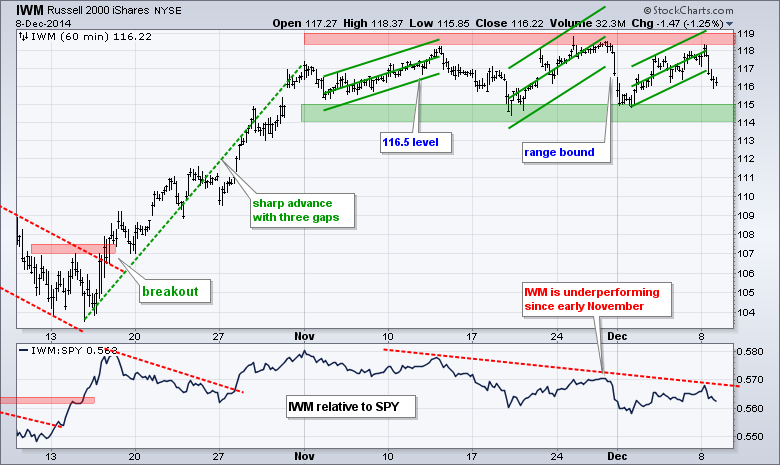
- IWM reversed off range resistance and is now poised to test range support.
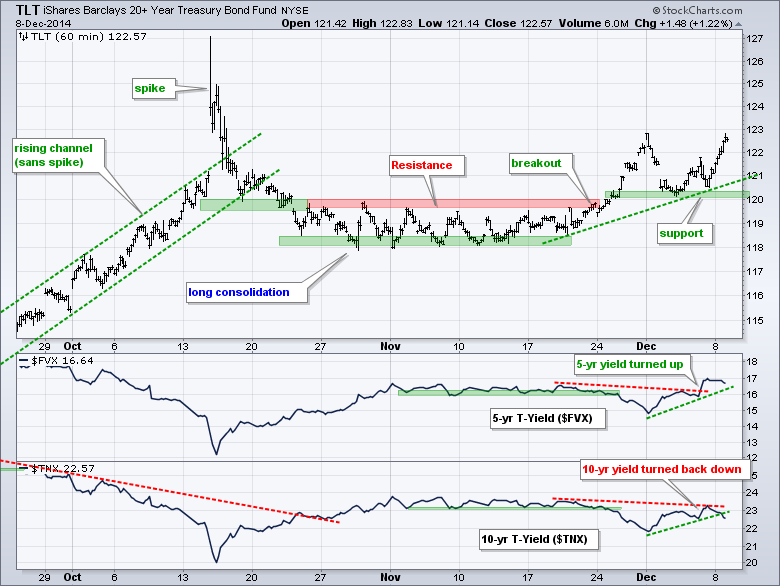
- TLT extended its bounce off support and remains in an uptrend. Key support remains at 120.
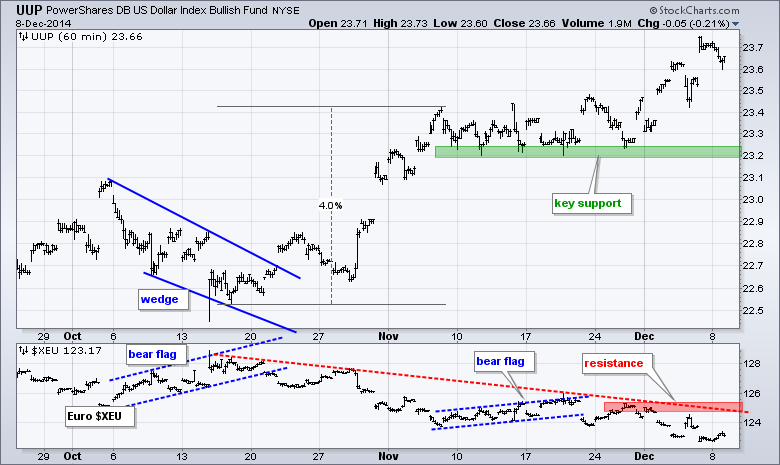
- UUP hit a new high last week and the Euro hit a new low to continue its downtrend.
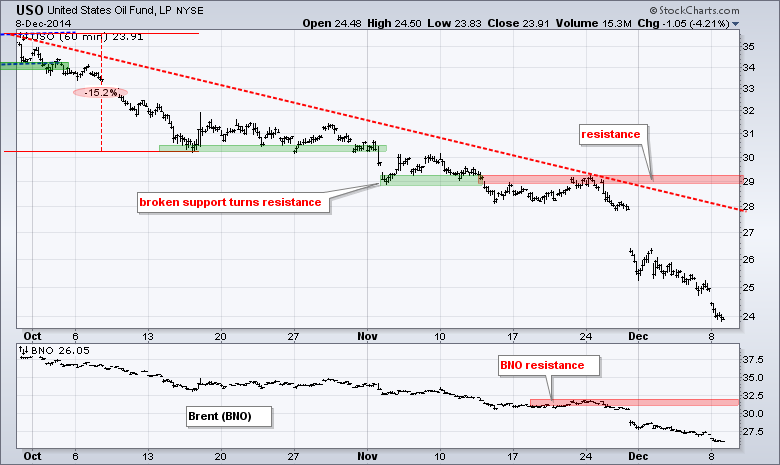
- USO firmed early last week, but fell again to continue its strong downtrend.
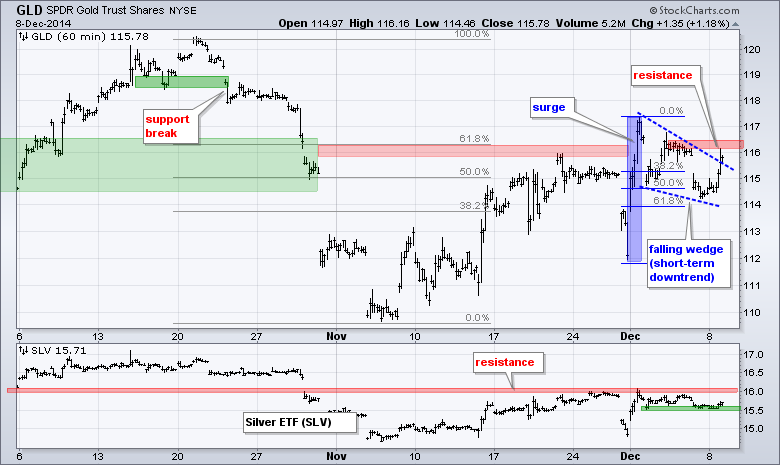
- GLD held a key retracement zone and broke the wedge trend line.
The December E-mini S&P 500 (^ESZ14) started weak and remained weak as a modest black candlestick formed. Some sideways price action after the massive Oct-Nov advance is perfectly normal. In fact, we could even get a small correction. Even with a break below last week's low, I would look for support in the 2020-2040 area.
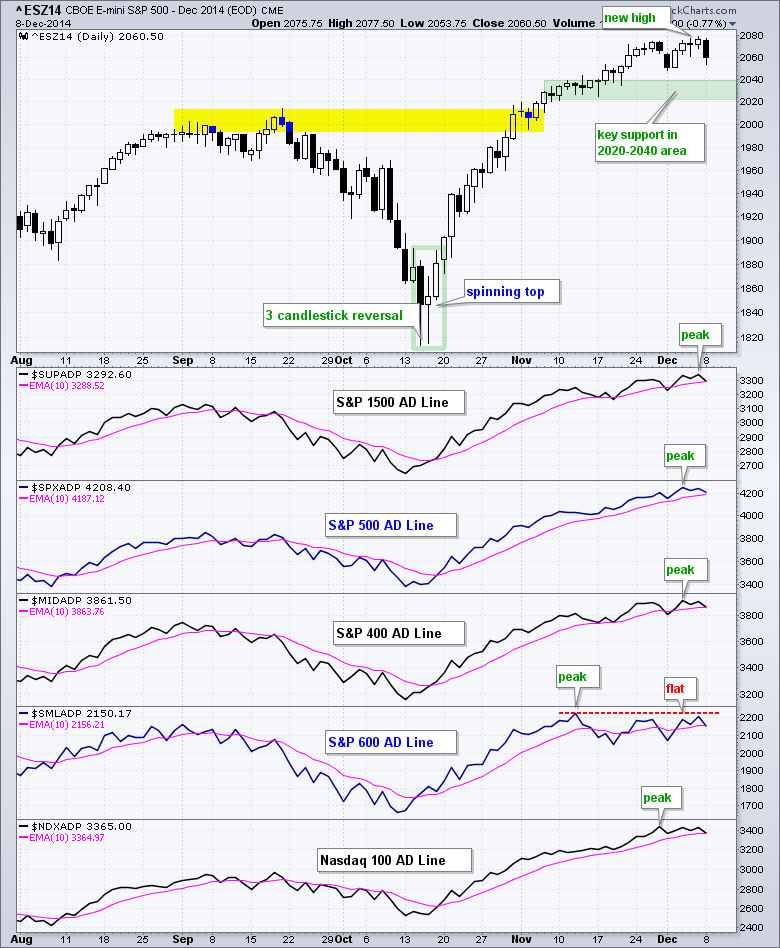
The AD Lines remain bullish overall, but we can see a progression of peaks as they tail off over the last few weeks. The S&P Small-Cap 600 AD Line was the first to peak in mid November and it has been flat for four weeks. The Nasdaq 100 AD Line peaked at the end of November and turned flat. The S&P 500 and S&P MidCap 400 AD Line peaked last Wednesday and flattened the last few days. This progressive flattening means a consolidation or correction could unfold in stocks.
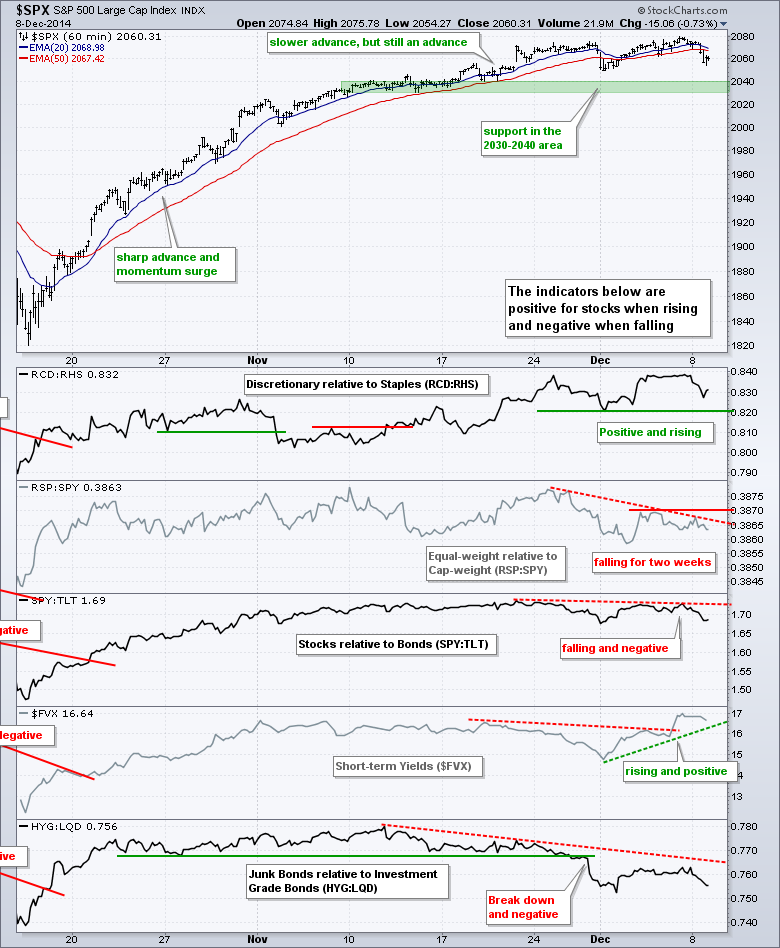
Three of the five risk indicators are considered negative and Treasuries are acting strange. The Equal-Weight S&P 500 ETF (RSP) has been underperforming the S&P 500 SPDR (SPY) for two weeks and I am downgrading this indicator to negative. The 10-YR Treasury Yield ($TNX) turned down and remains in a downtrend, which suggest that money is moving into long-term Treasury bonds and this is negative for stocks. On the other hand, money is moving out of short-term Treasuries because the 5-year Treasury Yield ($FVX) broke out and this is positive for stocks. Go figure. The High Yield Bond SPDR (JNK) continues to underperform the Investment Grade Bond ETF (LQD) because of energy-related bonds and this is negative the risk environment.
No change. The ETF surged in the second half of October and then embarked on a slow advance the last five weeks. SPY surged from 182 to 202 and then worked its way to 208, which is another six points higher. I am going to leave key support in the 203-204 area because the bigger trend is up and I would expect buyers to step in on any dip.
**************************************************************
QQQ broke the trend line extending up from early November and shows some relative weakness in December. Despite this decline and trend line break, I am looking for support in the 103 area and would watch for a reversal or bounce here. Apple also moved lower and I would watch the 108-110 area for potential support and a bounce.
**************************************************************
IWM hit resistance near the top of its consolidation and fell rather sharply on Monday. Boo hiss. The ETF broke the lower trend line of the Raff Regression Channel to reverse the upswing and is now headed for another support test. Despite bullish seasonal patterns the next few weeks, IWM continues to lag and has underperformed since early November. Price action trumps seasonal patterns.
**************************************************************
No change. Non-farm payrolls blew through estimates and came in at the highest level since January 2012 (321,000). This news is normally bearish for Treasuries, but the 20+ YR T-Bond ETF (TLT) managed to hold support and even bounce late Friday. I will keep key support at 120 and refrain from turning bearish until a break here.
**************************************************************
No change. The US Dollar ETF (UUP) toyed with support for a few weeks and then surged to new highs last week. The big trend has been up for a long time and the new high simply affirms this uptrend. The November lows mark key support in the 23.2 area. The Euro Index ($XEU) broke flag support in mid November, bounced and then moved to new lows last week. Key resistance is set at 126.
**************************************************************
No change. The USO Oil Fund (USO) tried to firm, but selling pressure hit again and the ETF hit another new low on Friday. The oversold simply remain oversold and this is testament to the strength of the downtrend. Key resistance remains in the 29 area for now.
**************************************************************
Even though the long-term trend is down, gold is getting interesting and showing resilience. Note that gold and the Dollar Index are both up over the last five weeks. On the price chart, the Gold SPDR (GLD) surged in early December and then formed a falling wedge that retraced 50-62% of this surge. The retracement zone held and GLD broke the wedge trend line with a nice move. This is the first sign that gold wants to move higher and a break though 116.5 would clear the way for further gains.
***************************************************************
Key Reports and Events (all times Eastern):
Tue - Dec 09 - 10:00 - Wholesale Inventories
Tue - Dec 09 - 10:00 - JOLTS - Job Openings
Wed - Dec 10 - 07:00 - MBA Mortgage Index
Wed - Dec 10 - 10:30 - Crude Oil Inventories
Wed - Dec 10 - 14:00 - Treasury Budget
Thu - Dec 11 - 08:30 - Initial Jobless Claims
Thu - Dec 11 - 08:30 - Retail Sales
Thu - Dec 11 - 10:30 - Natural Gas Inventories
Fri - Dec 12 - 08:30 - Producer Price Index (PPI)
Fri - Dec 12 - 09:55 - Michigan Sentiment
Charts of Interest are on Tuesdays and Thursdays.
This commentary and charts-of-interest are designed to stimulate thinking. This analysis is not a recommendation to buy, sell, hold or sell short any security (stock ETF or otherwise). We all need to think for ourselves when it comes to trading our own accounts. First, it is the only way to really learn. Second, we are the only ones responsible for our decisions. Think of these charts as food for further analysis. Before making a trade, it is important to have a plan. Plan the trade and trade the plan. Among other things, this includes setting a trigger level, a target area and a stop-loss level. It is also important to plan for three possible price movements: advance, decline or sideways. Have a plan for all three scenarios BEFORE making the trade. Consider possible holding times. And finally, look at overall market conditions and sector/industry performance.


