Stocks got a big dose of good news on Friday as non-farm payrolls added over 300,000 for the second time this year. The employment report capped off a strong week for economic indicators. Despite a positive news week, stocks were quite flat and Friday's gains were contained. Even though the short-term uptrends remain for SPY and QQQ, the inability to advance in the face of good news suggest that the bulls are getting tired. I would not expect a major reversal here, but we could see a pullback or some profit taking. SPY and QQQ are up over 10% in the last seven weeks.
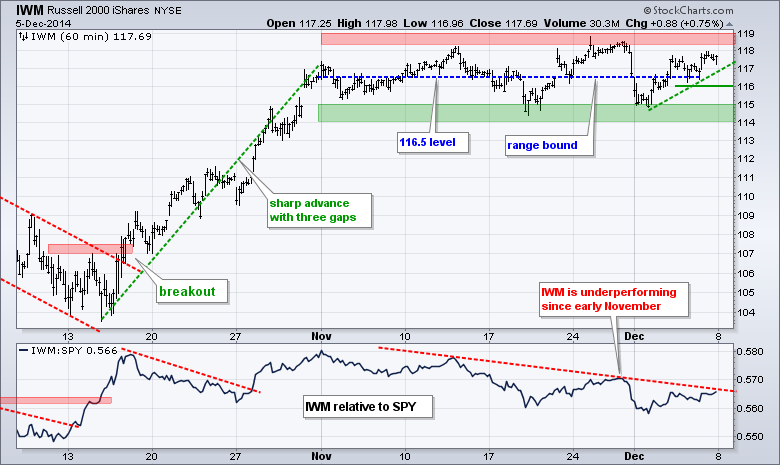
Tom Bowley and I noted some bullish seasonal patterns in the Russell 2000 in the ChartWatchers newsletter over the weekend. In short, the second half of December has a strong bullish bias for stocks and small-caps in particular. IWM has been consolidating the last five weeks and a break above 119 would be very bullish for yearend. Note that IWM was strong on Friday and is now outperforming SPY in December. Yes, IWM is up .86% so far this month and SPY is up just .39%.
**This chart analysis is for educational purposes only, and should not
be construed as a recommendation to buy, sell or sell-short said securities**
Short-term Overview (Monday, 8-December-2014):
- The positives still outweigh the negatives for the stock market.
- Three of the five AD Lines hit new highs last week.
- The 5-year Treasury Yield surged as money moved out of short-term Treasuries.
- SPY remains in a short-term uptrend with support in the 203-204 area.
- QQQ remains in an uptrend with support in the 102.5-103.5 area.
- IWM has been range bound since early November, but in an upswing within this range.
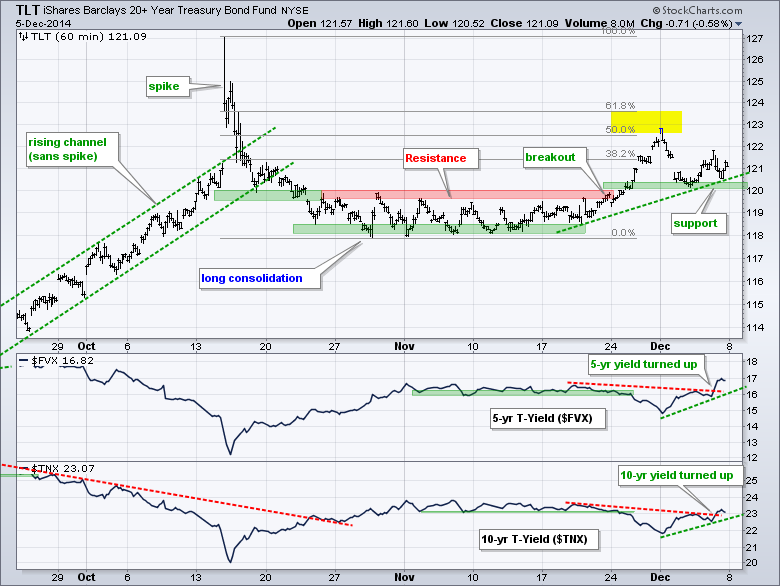
- TLT broke out at 120 on 21-Nov, pulled back and bounced off this breakout zone. Key support is now at 120.
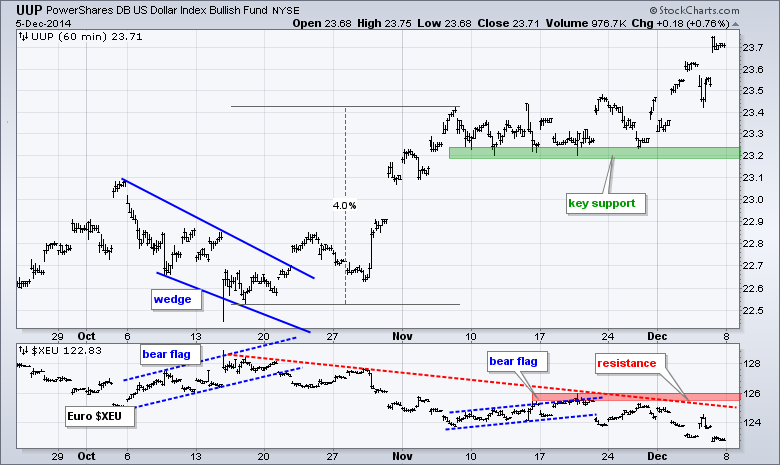
- UUP hit a new high last week and the Euro hit a new low to continue its downtrend.
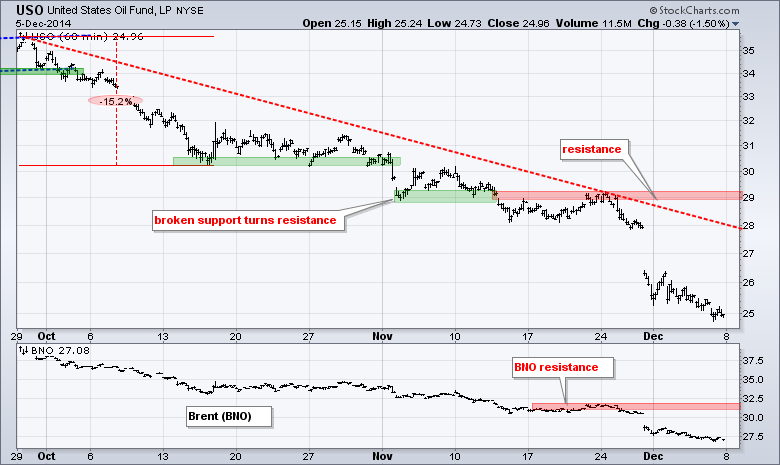
- USO firmed at the beginning of the week, but fell at the end of the week to continue its strong downtrend.
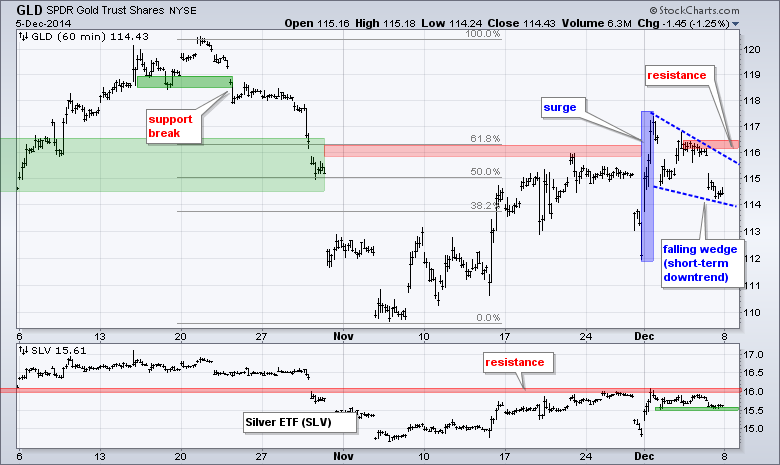
- GLD broke down on Friday, but could form a falling wedge and I am watching for a breakout.
The December E-mini S&P 500 (^ESZ14) fell on Monday, bounced back on Tuesday and edged higher the last three days. Despite hitting a new high on Thursday and Friday, upside was subdued and price action was quite indecisive. The overall trend remains up with support marked in the 2020-2040 area.
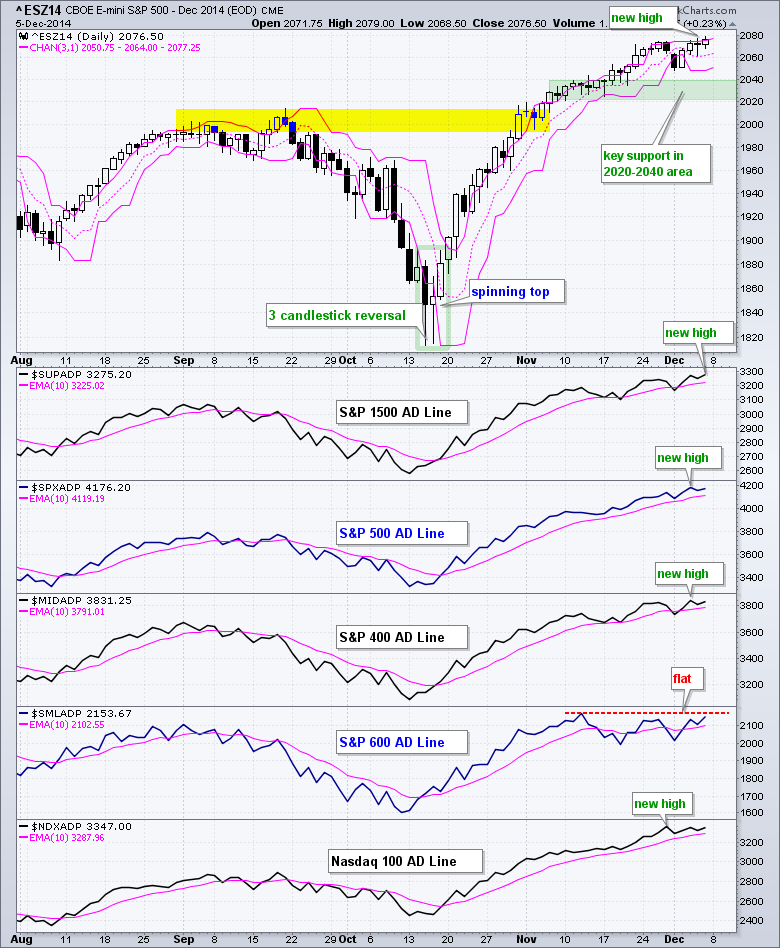
Three of the five AD Lines hit new highs last week (S&P 1500, S&P 500 and S&P MidCap 400). Four of the five AD Lines are in uptrends and stock market breadth is bullish overall. In a strange twist, the S&P Small-Cap 600 AD Line moved above its late November high and finished the week strong. This is why the S&P 1500 AD Line finished the week at a new high. The S&P Small-Cap 600 AD Line, however, remains below its mid November high and continues to lag the others over the last few weeks. A break above this high would be bullish for small-cap breadth.
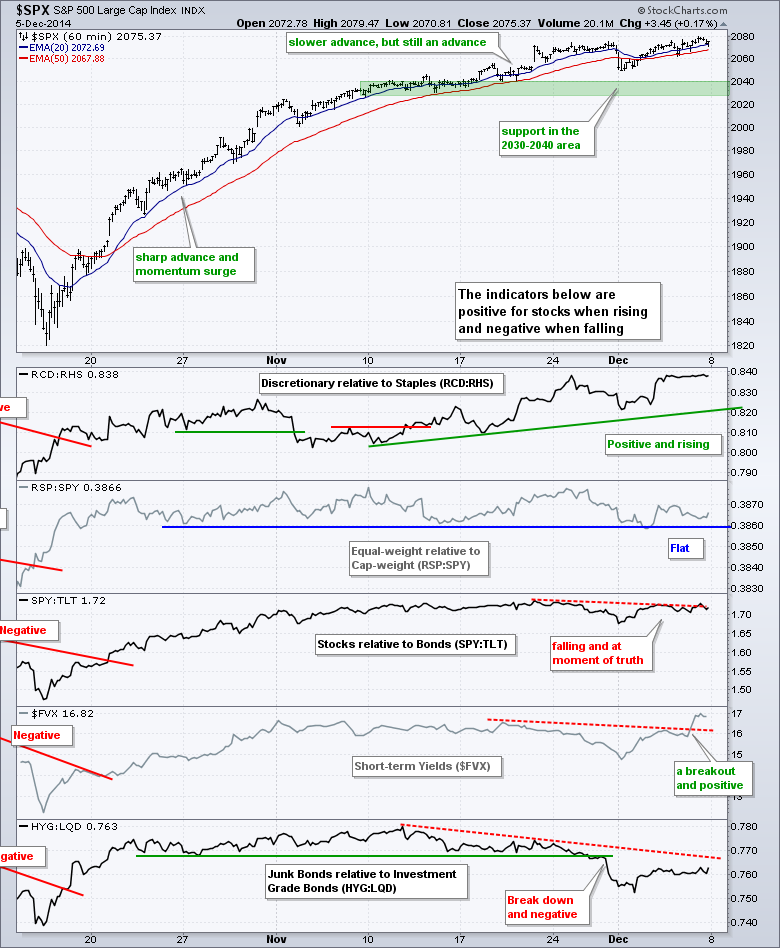
The risk indicators are still mixed. The XLY:XLP ratio is rising and this is positive for stocks overall. The RSP:SPY ratio has been flat since late October. The Equal-Weight S&P 500 ETF (RSP) is not underperforming so I would not consider this negative yet. Treasury yields surged as the 5-year Yield broke out and turned positive. The 10-year Yield is still on the verge of a breakout. The JNK:LQD ratio remains negative because weakness in energy-related junk bonds hit the High Yield Bond SPDR (JNK) quite hard.
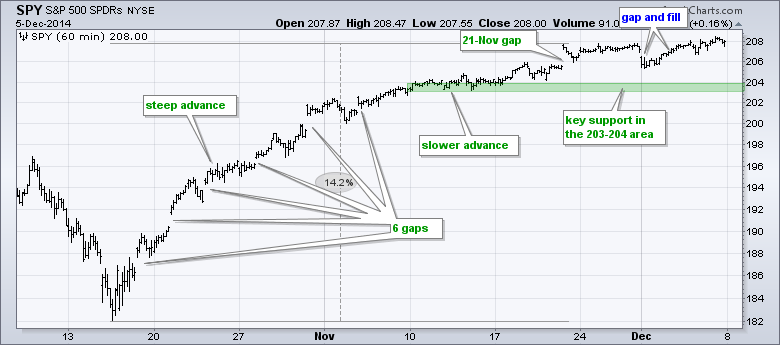
Once again, there is really no change on the SPY chart. The ETF surged in the second half of October and then embarked on a slow advance the last five weeks. SPY surged from 182 to 202 and then worked its way to 208, which is another six points higher. I am going to leave key support in the 203-204 area because the bigger trend is up and I would expect buyers to step in on any dip.
**************************************************************
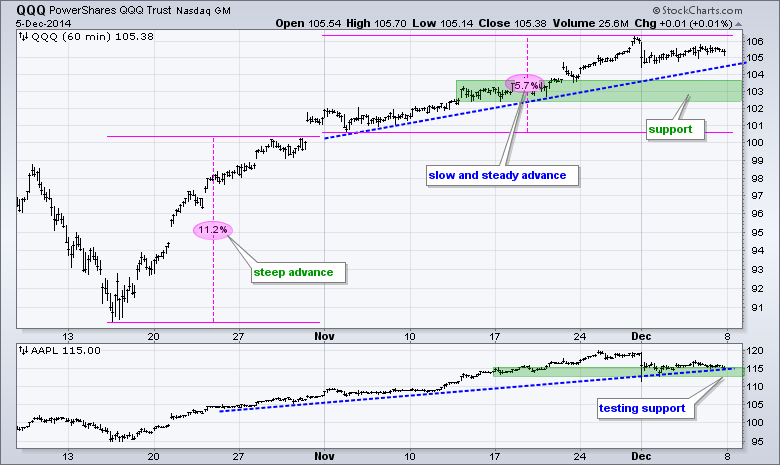
QQQ surged 11.2% in two weeks and then added another 5+ percent over the last five weeks. The ETF fell sharply last Monday and then stalled the rest of the week (blame Apple). This shows a little relative weakness because SPY finished the week at a new high. QQQ could correct here, but I am still more inclined to expect a subsequent bounce and will be watching support in the 102.5-103.5 area. AAPL is at support and could get a bounce off the 113-115 area.
**************************************************************
IWM surged in the second half of October and then moved into a trading range the last five weeks. The ETF bounced off support on Monday and is nearing resistance with the current upswing. A break below 116 would reverse this upswing. Overall, this consolidation looks like a flat flag and a break above 119 would be very bullish. IWM has been underperforming SPY since early November and the price relative (IWM:SPY ratio) needs to break above the late November high for IWM to start showing relative strength again.
**************************************************************
Non-farm payrolls blew through estimates and came in at the highest level since January 2012 (321,000). This news is normally bearish for Treasuries, but the 20+ YR T-Bond ETF (TLT) managed to hold support and even bounce late Friday. I will keep key support at 120 and refrain from turning bearish until a break here.
**************************************************************
The US Dollar ETF (UUP) toyed with support for a few weeks and then surged to new highs last week. The big trend has been up for a long time and the new high simply affirms this uptrend. The November lows mark key support in the 23.2 area. The Euro Index ($XEU) broke flag support in mid November, bounced and then moved to new lows last week. Key resistance is set at 126.
**************************************************************
The USO Oil Fund (USO) tried to firm, but selling pressure hit again and the ETF hit another new low on Friday. The oversold simply remain oversold and this is testament to the strength of the downtrend. Key resistance remains in the 29 area for now.
**************************************************************
Gold remains a tough call right now. Note that gold and the Dollar Index are up since early November. The Dollar is up around 3% and gold is up 2.3%. Perhaps the gold market is eyeing quantitative easing in Japan and potential QE in Europe for 2015. Whatever the reason, gold is showing some resilience the last five weeks. On the 30 minute chart, the Gold SPDR (GLD) hit resistance in the 116 area and broke support on Friday. This is short-term bearish, but a falling wedge could be taking shape and a break above 116.5 would be short-term bullish. Resistance for the Silver ETF (SLV) is set at 16.10.
***************************************************************
Key Reports and Events (all times Eastern):
Tue - Dec 09 - 10:00 - Wholesale Inventories
Tue - Dec 09 - 10:00 - JOLTS - Job Openings
Wed - Dec 10 - 07:00 - MBA Mortgage Index
Wed - Dec 10 - 10:30 - Crude Oil Inventories
Wed - Dec 10 - 14:00 - Treasury Budget
Thu - Dec 11 - 08:30 - Initial Jobless Claims
Thu - Dec 11 - 08:30 - Retail Sales
Thu - Dec 11 - 10:30 - Natural Gas Inventories
Fri - Dec 12 - 08:30 - Producer Price Index (PPI)
Fri - Dec 12 - 09:55 - Michigan Sentiment
Charts of Interest are on Tuesdays and Thursdays.
This commentary and charts-of-interest are designed to stimulate thinking. This analysis is not a recommendation to buy, sell, hold or sell short any security (stock ETF or otherwise). We all need to think for ourselves when it comes to trading our own accounts. First, it is the only way to really learn. Second, we are the only ones responsible for our decisions. Think of these charts as food for further analysis. Before making a trade, it is important to have a plan. Plan the trade and trade the plan. Among other things, this includes setting a trigger level, a target area and a stop-loss level. It is also important to plan for three possible price movements: advance, decline or sideways. Have a plan for all three scenarios BEFORE making the trade. Consider possible holding times. And finally, look at overall market conditions and sector/industry performance.
