The market went into a risk-off mode on Thursday with the Russell 2000 iShares (IWM) losing .48% and the 20+ YR T-Bond ETF (TLT) surging .84% ahead of today's employment report. Even though the surge in Treasuries shows a certain flight to safety, I do not blame the economy because the economic indicators remain strong. Instead, the plunge energy prices and surge in the Dollar indicate that inflation will not be a problem and this is positive for Treasuries. Money could also be moving out of energy-related junk bonds and finding its way into Treasuries. Today is, of course, the employment report and this could add a little extra volatility to the market. Today's report will not be a game changer for stocks, but it could affect Treasuries and I will be watching TLT closely.
**This chart analysis is for educational purposes only, and should not
be construed as a recommendation to buy, sell or sell-short said securities**
Short-term Overview (Friday, 5-December-2014):
- The positives still outweigh the negatives for the stock market.
- Three of the five AD Lines hit new highs this week.
- The TLT:SPY ratio and the 5-year Treasury Yield are at potential inflection points.
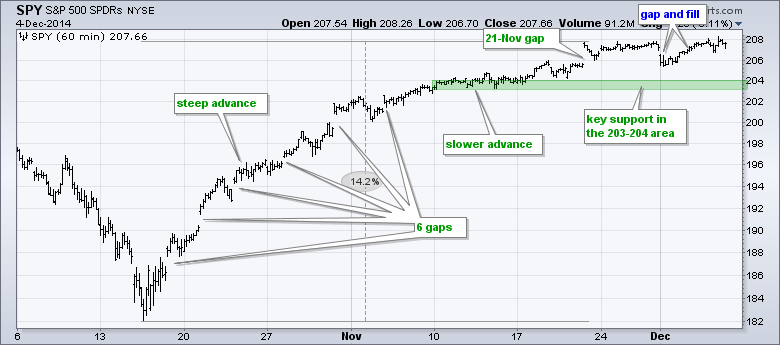
- SPY remains in a short-term uptrend with support in the 203-204 area.
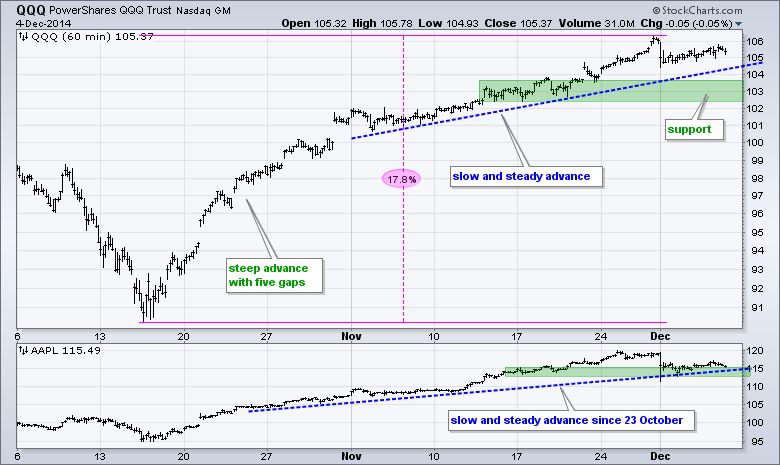
- QQQ remains in an uptrend with support in the 102.5-103.5 area.
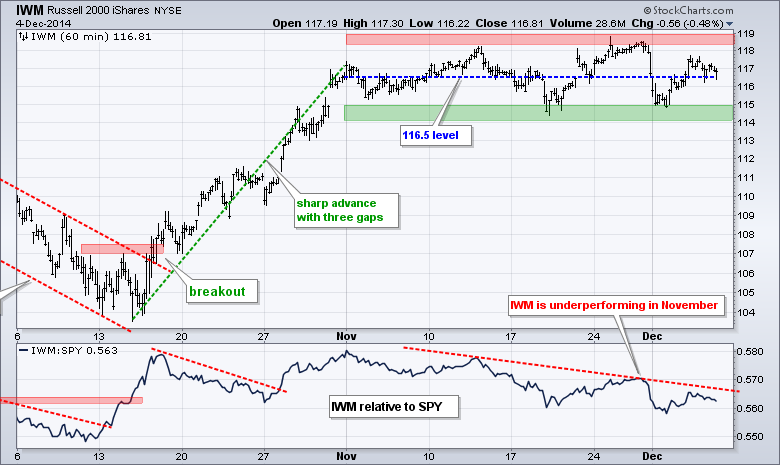
- IWM has been range bound since early November, but in an upswing within this range.
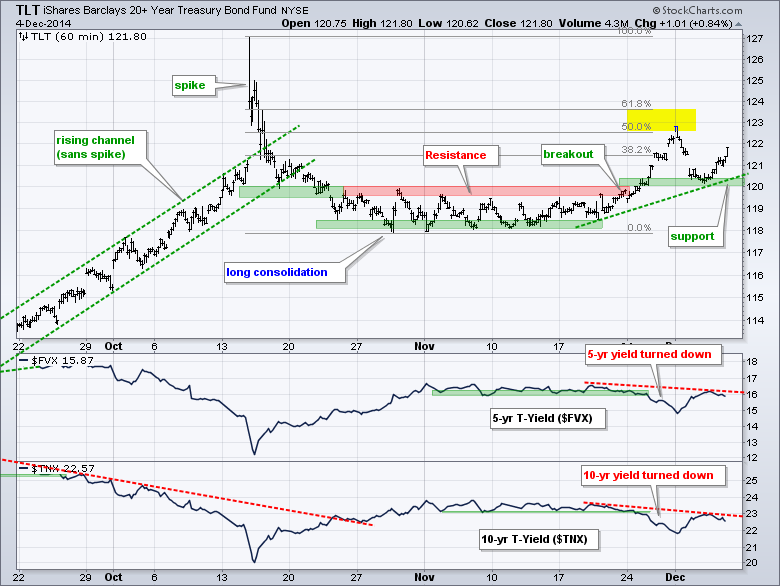
- TLT broke out at 120 on 21-Nov, pulled back and bounced off this breakout zone. Key support is now at 120.
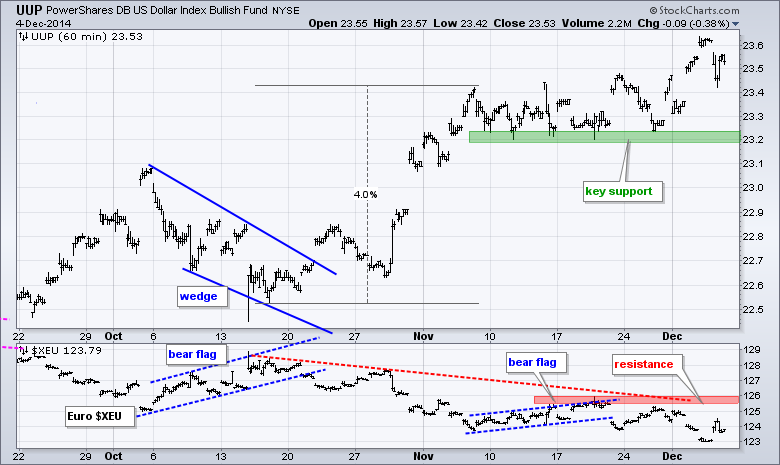
- UUP hit a new high on Wednesday and the Euro continued lower.
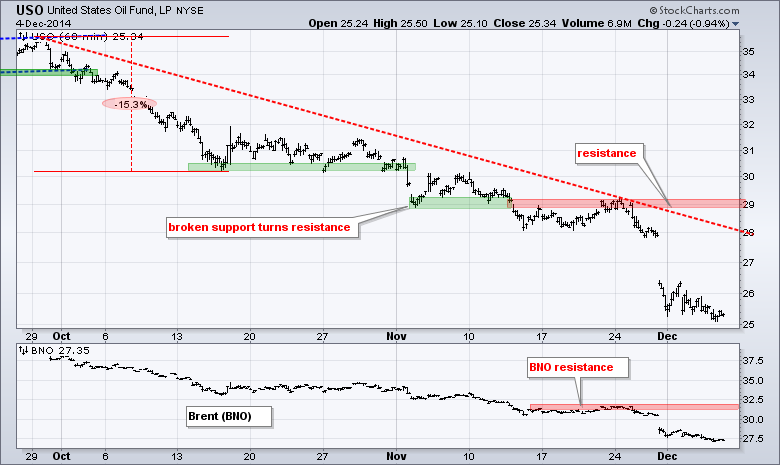
- USO firmed the last few days, but remains in a clear downtrend.
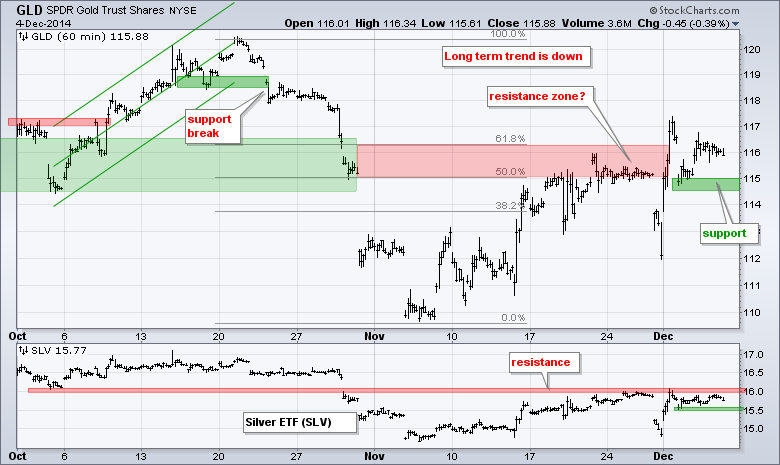
- GLD remains in an upswing, but it still looks like a bear market bounce.
The December E-mini S&P 500 (^ESZ14) stalled with an indecisive candlestick on Thursday, but remains in an uptrend overall. Stalling just means buying and selling pressure have equalized. Selling pressure was not stronger than buying pressure and the bias remains bullish with key support in the 2020-2040 area.
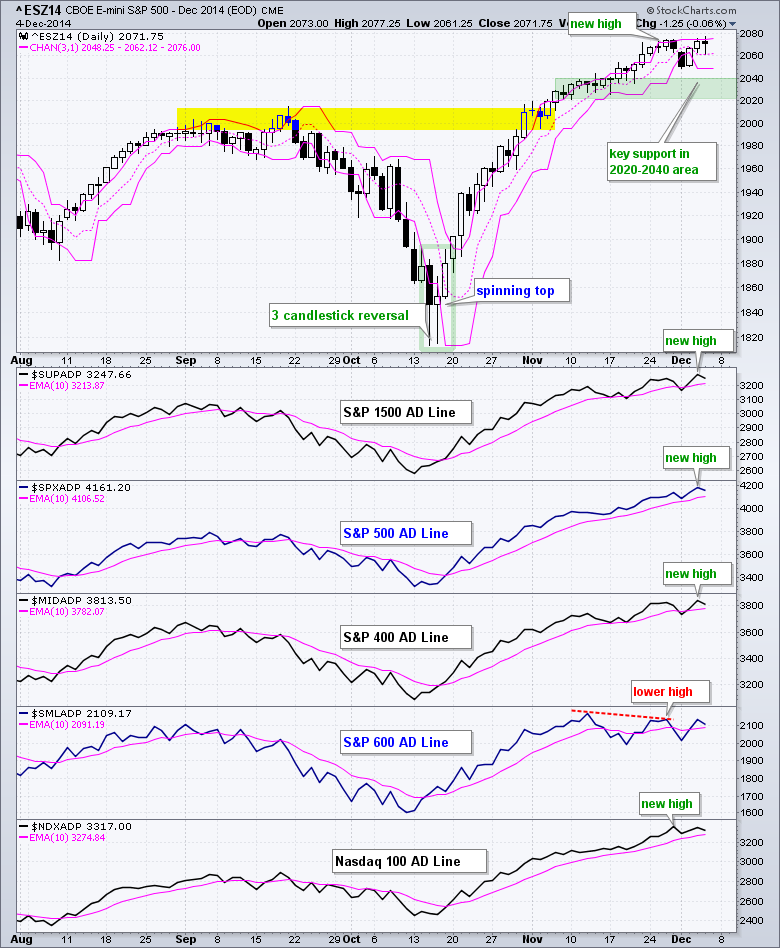
Four of the five AD Lines are in clear uptrends. The AD Lines for the S&P 500, S&P MidCap 400 and S&P 1500 hit new highs this week and are the strongest. The Nasdaq 100 AD Line hit a new high last week and remains above its 10-day EMA (uptrend). The S&P Small-Cap 600 AD Line formed a lower high in late November and has a small bearish divergence working.
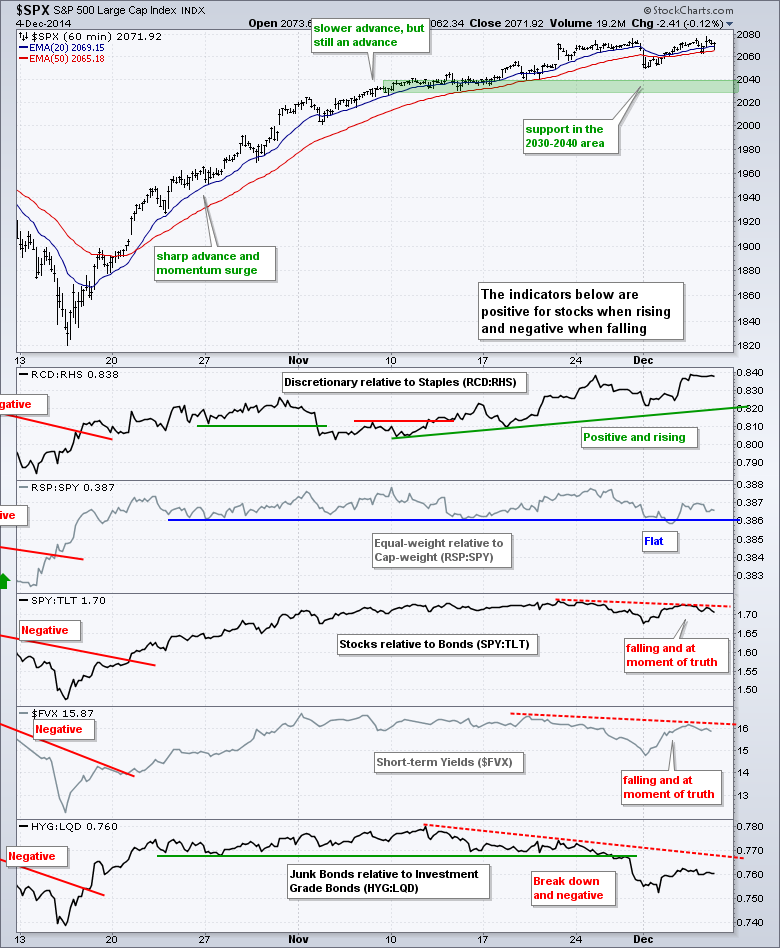
The risk indicators are mixed with two at a key juncture. First and foremost, the consumer discretionary sector continues to outperform the consumer staples sector. On the negative side, SPY underperformed TLT over the last two weeks and the 5-year Treasury Yield fell as money moved into Treasury bonds. Today is the employment report and the moment-of-truth for Treasuries. Breakouts in the SPY:TLT ratio and the 5-year Treasury Yield would indicate that money is moving out of Treasury bonds and this would be positive for stocks.
No change. SPY gapped down on Monday and actually filled the 21-Nov gap above 206. Monday's gap did not last long as the ETF worked its way back to 208 and hit a new high intraday. I could mark support at 205, but will leave key support in the 203-204 area to allow for a buffer in the strong uptrend.
**************************************************************
No change. QQQ has turned rather boring this week with a tight range around the 105 area. Blame Apple, which has traded in the 115 area for most of the last three days. The QQQ trend remains up and we are seeing upside leadership from semiconductors, which is positive for the tech sector. I am leaving key support in the 102.5-103.5 area for now.
**************************************************************
No change. IWM remains a challenge because it is simply bouncing within a trading range. The ETF has crossed the 116.5 level at least six times in the last five weeks. With a bounce off the late November low, the ETF is in the midst of another upswing. However, IWM continues to underperform SPY and IWM is not the vehicle of choice for the current uptrend in stocks.
**************************************************************
And now for the employment report... The 20+ YR T-Bond ETF (TLT) broke out last week and tested this breakout with a pullback to the 120 area this week. The bounce over the last two days reinforces support at 120 and I will raise key support to this level. Failure to hold this bounce and a break below 120 would be bearish for Treasury bonds. In the indicator windows, the 10-YR Treasury Yield ($TNX) and the 5-year Treasury Yield ($FVX) need to break above this week's high to reverse their slides.
**************************************************************
No change. The US Dollar ETF (UUP) toyed with support for a few weeks and then surged to new highs this week. The big trend has been up for a long time and the new high simply affirms this uptrend. The November lows mark key support in the 23.2 area. The Euro Index ($XEU) broke flag support in mid November, bounced and moved lower again on Tuesday. Key resistance is set at 126.
**************************************************************
No change. The USO Oil Fund (USO) firmed for over a week and then plunged to new lows after the OPEC meeting. It is basically a supply issue because OPEC kept its quotas, fracking continues and Iran may even increase production in the coming months if talks progress. USO is once again oversold, but still in a clear downtrend with resistance marked in the 29 area.
**************************************************************
No change. Gold remains very volatile and risky, but the long-term trend is still down. This means I am inclined to look for peaks and bearish reversals, not breakouts and extended advances. The current advance retraced just over 62% with the move to 116. With a bounce on Wednesday, I am marking first support at 114.50 and a break below this level would reverse the current upswing.
***************************************************************
Key Reports and Events (all times Eastern):
Fri - Dec 05 - 08:30 - Employment Report
Fri - Dec 05 - 10:00 - Factory Orders
Fri - Dec 05 - 15:00 - Consumer Credit
Charts of Interest are on Tuesdays and Thursdays.
This commentary and charts-of-interest are designed to stimulate thinking. This analysis is not a recommendation to buy, sell, hold or sell short any security (stock ETF or otherwise). We all need to think for ourselves when it comes to trading our own accounts. First, it is the only way to really learn. Second, we are the only ones responsible for our decisions. Think of these charts as food for further analysis. Before making a trade, it is important to have a plan. Plan the trade and trade the plan. Among other things, this includes setting a trigger level, a target area and a stop-loss level. It is also important to plan for three possible price movements: advance, decline or sideways. Have a plan for all three scenarios BEFORE making the trade. Consider possible holding times. And finally, look at overall market conditions and sector/industry performance.


