Stocks moved sharply higher with a broad advance that lifted most boats. The Russell MicroCap iShares (IWC) and Russell 2000 iShares (IWM) led the charge with 3+ percent moves. As noted on Monday-Tuesday, small-caps have been outperforming in December and small-cap breadth was holding up better than large-cap breadth. Relative strength played out on Wednesday with big moves in small-caps. Much of this move, though, came from energy stocks as the SmallCap Energy ETF (PSCE) surged almost 9%. The SmallCap Consumer Discretionary ETF (PSCD) was the second leading sector with a 2+ percent gain. Large-cap financials had a good day with the Finance SPDR (XLF) gaining over 2%. Elsewhere, the Home Construction iShares (ITB) surged over 3%, the Broker-Dealer iShares (IAI) was up almost 3%, the Internet ETF (FDN) gained 2.5% and the Biotech SPDR (XBI) surged a whopping 4.77%. Despite these big moves, QQQ and SPY remain short of breakouts and still short-term downtrends. IWM, on the other hand, did get a breakout and looks the most promising.
**This chart analysis is for educational purposes only, and should not
be construed as a recommendation to buy, sell or sell-short said securities**
Short-term Overview (Thursday, 18-December-2014):
- Three of the five AD Lines moved above their 10-day EMAs and the small-cap AD Line is performing the best.
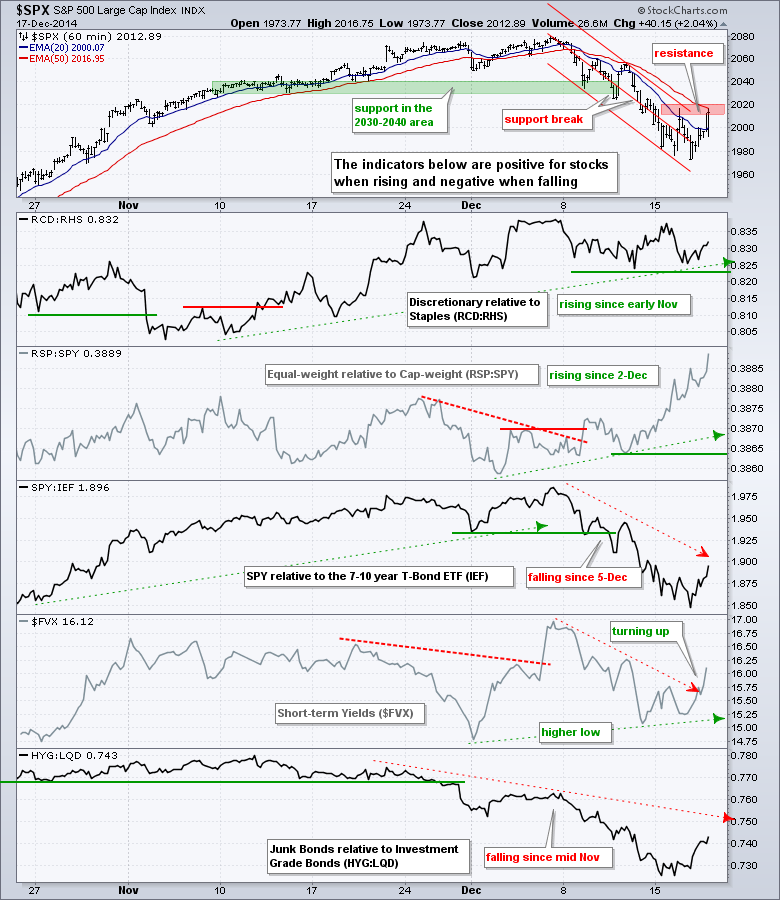
- Short-term yields rose and three of the five risk indicators are now positive.
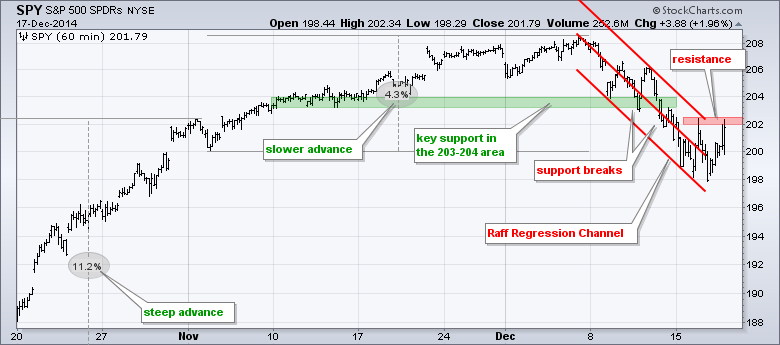
- SPY remains in a short-term downtrend with resistance at 202.5.
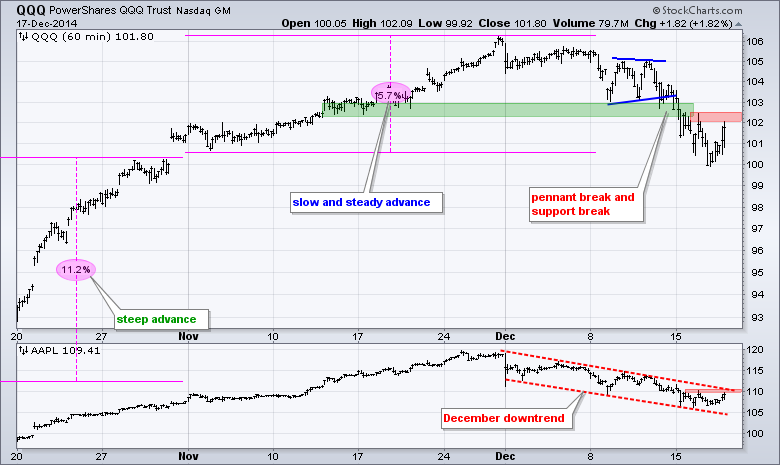
- QQQ remains in a short-term downtrend with resistance at 102.5.
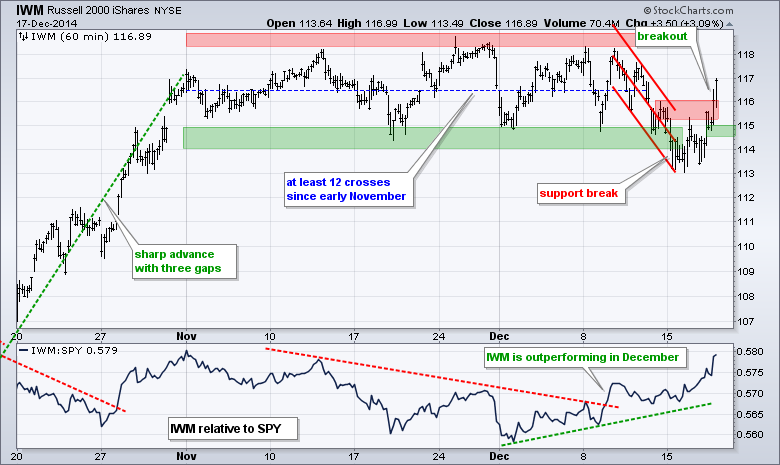
- IWM broke out at 116 and shows relative strength. Support is set at 114.5.
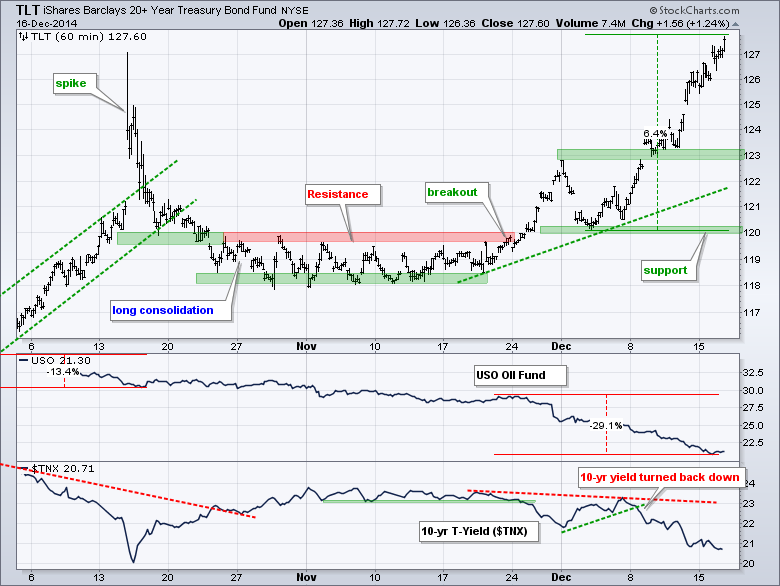
- TLT was overbought and fell back after the Fed statement, but remains in an uptrend.
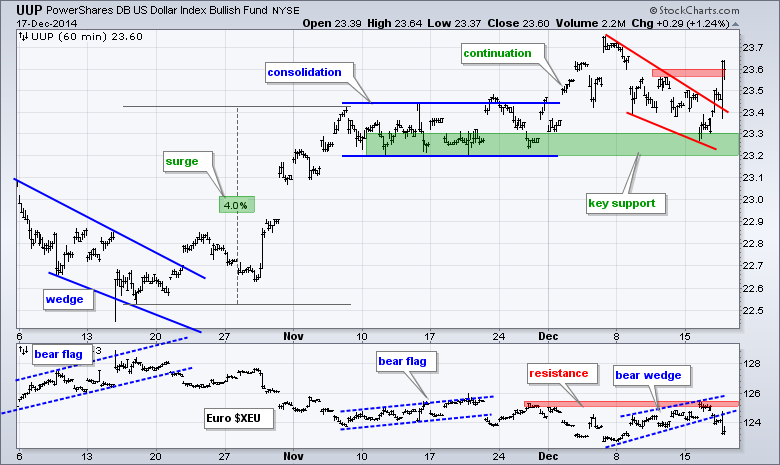
- UUP got a wedge breakout and the Euro got a wedge break down to continue their respective trends.
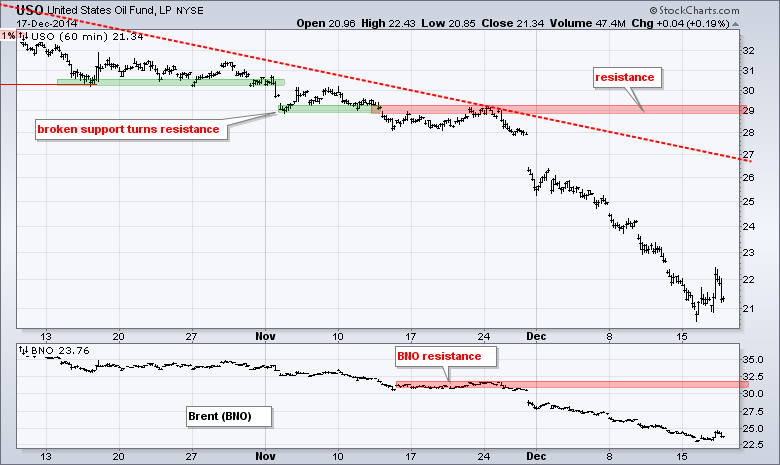
- USO remains in a strong downtrend.
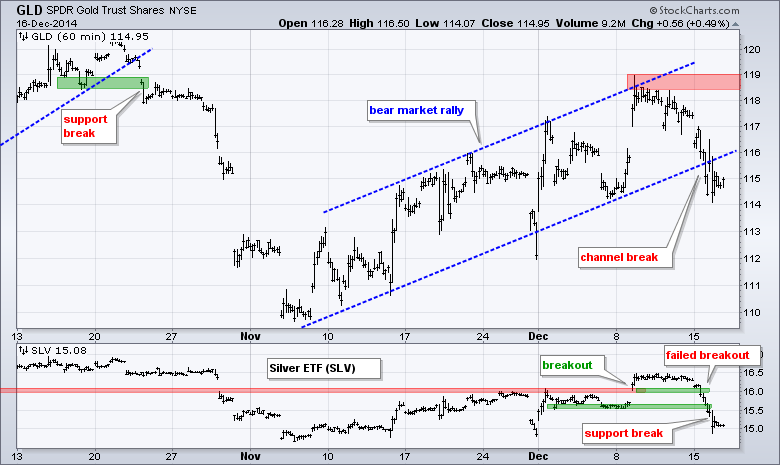
- GLD broke channel support earlier this week and the support break turns first resistance in the 116-116.5 area.
The December E-mini S&P 500 (^ESZ14) opened firm and closed strong to produce its biggest gain of the year (+2.09%) The E-mini finished right at resistance and a little follow thru would produce a breakout. There was an overshoot on Monday-Tuesday, but Wednesday's rebound puts the 2000 area back in play as a support zone.
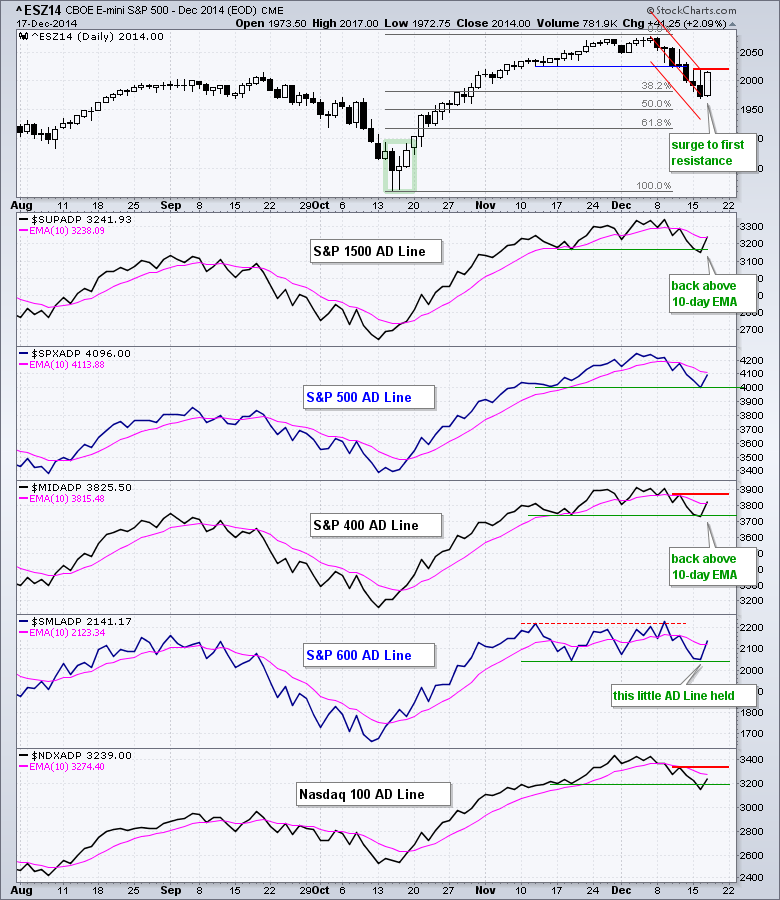
Three of the five AD Lines are back above their 10-day EMAs (S&P 1500, S&P MidCap 400 and S&P Small-Cap 600). Note that the S&P Small-Cap 600 AD Line was the only one to hold its mid November low and remain in an uptrend during the December pullback. Small-cap High-Low Percent ($SMLHLP) was also held above -5%, where as $SPX High-Low Percent ($SPXHLP) and $MID High-Low Percent ($MIDHLP) dipped below -5% on Tuesday.
Three of the five risk indicators are positive for stocks and two stand out. First, the Equal-Weight S&P 500 ETF (RSP) is outperforming the S&P 500 SPDR (SPY) as the RSP:SPY ratio surged above its November highs. This means the average stock in the S&P 500 is outperforming the large-cap stocks. Second, the 5-year Treasury Yield ($FVX) held above its early December low and surged on Wednesday. Short-term yields have been moving higher since October and this means money is moving out of short-term Treasury bonds, which is positive for stocks.
SPY moved above/below the 200 level several times the last few days and then closed at its highest level of the week (all three days of it). The short-term downtrend remains, but this surge is the first sign of a reversal and a resistance break at 202.5 would fully reverse the short-term slide.
**************************************************************
QQQ and Apple are dragging their feet a bit. QQQ is still 70 cents from resistance and Apple did not break out. I am marking first resistance for QQQ at 102.5 and resistance for Apple at 111.
**************************************************************
IWM is leading the market right now with a breakout and relative strength. The ETF is the first to break above Friday's high and the price relative is nearing its November high. I am marking support at 114.5, a break of which would negate the breakout.
**************************************************************
No change. Oil is down around 25+ percent the last three weeks and the 20+ YR T-Bond ETF (TLT) is up around 5.5% in two weeks. The decline in oil also weighed on the junk bond market. Treasury bonds are benefitting from lower expectations for inflation and a flight to safety in the bond market. On the TLT chart, broken resistance turns first support in the 123 area. Key support remains in the 120 area for now.
**************************************************************
The US Dollar ETF (UUP) held support and surged above resistance at 23.6 to signal a continuation of the uptrend. This move reinforces support in the 23.2-23.3 area. The Euro Index ($XEU) failed at resistance and broke wedge support with a sharp decline. Resistance is marked at 125.50
**************************************************************
No change. The USO Oil Fund (USO) remains in a strong downtrend.
**************************************************************
No change. The Gold SPDR (GLD) had a flag working last week and had every chance to breakout, but did not and moved sharply lower on Monday. This move broke the lower trend line of a rising channel and erased last week's surge. With the bigger trend down, this looks like a continuation breakdown and a move to new lows is expected.
***************************************************************
Key Reports and Events (all times Eastern):
Thu - Dec 18 - 08:30 - Initial Jobless Claims
Thu - Dec 18 - 10:00 - Philadelphia Fed
Thu - Dec 18 - 10:00 - Leading Economic Indicators
Thu - Dec 18 - 10:30 - Natural Gas Inventories
Fri - Dec 18 - 08:00 - TGIF
Charts of Interest will now appear in Tuesday's Market Message Webinar.
This commentary and charts-of-interest are designed to stimulate thinking. This analysis is not a recommendation to buy, sell, hold or sell short any security (stock ETF or otherwise). We all need to think for ourselves when it comes to trading our own accounts. First, it is the only way to really learn. Second, we are the only ones responsible for our decisions. Think of these charts as food for further analysis. Before making a trade, it is important to have a plan. Plan the trade and trade the plan. Among other things, this includes setting a trigger level, a target area and a stop-loss level. It is also important to plan for three possible price movements: advance, decline or sideways. Have a plan for all three scenarios BEFORE making the trade. Consider possible holding times. And finally, look at overall market conditions and sector/industry performance.


