Stocks continued higher with a broad advance that lifted most boats - again. The two-day surge in SPY is the biggest since 2011 and the two day decline in TLT is the largest since November 2013. Clearly, money moved out of the Treasury market and found its way into the stock market. In addition, the 2-year Treasury Yield ($UST2Y) moved to its highest level since the spring of 2011. A multi-year high in short-term yields is a vote of confidence in the economy and a vote for the normalization of interest rates in 2015. Forget Fed-speak and watch the Treasury market for clues. This is net positive for stocks. IWM led the way with a breakout on Wednesday. QQQ and SPY followed suit with breakouts on Thursday. It is now important that these breakouts hold and I have marked support levels accordingly.
**This chart analysis is for educational purposes only, and should not
be construed as a recommendation to buy, sell or sell-short said securities**
Short-term Overview (Friday, 19-December-2014):
- All five AD Lines are above their 10-day EMAs and four broke above last Thursday's high.
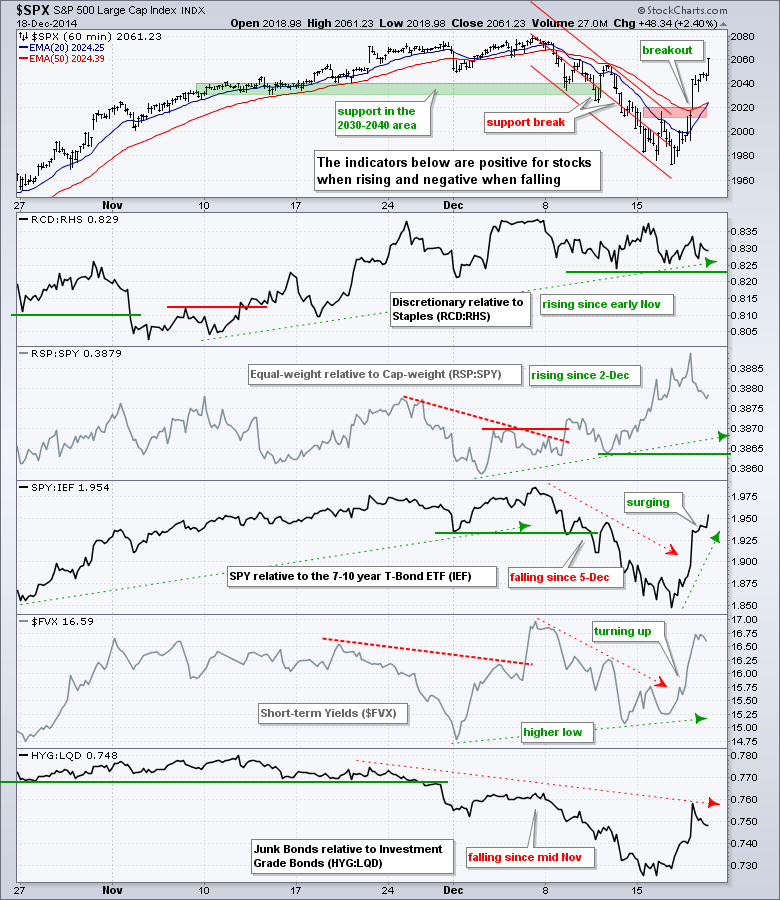
- Stocks outperformed bonds the last two days and four of the five risk indicators are positive.
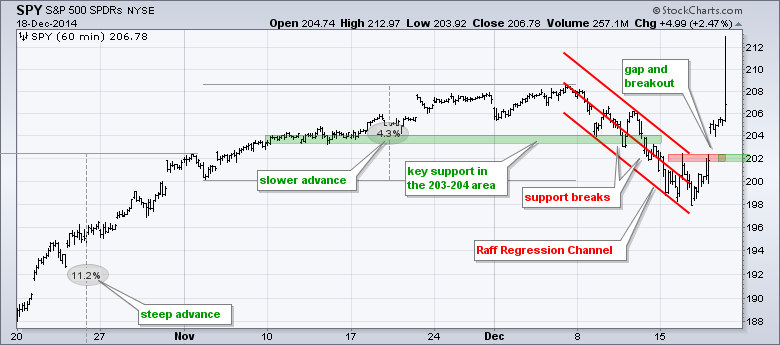
- SPY broke out with a gap and the breakout is valid as long as 201.8 holds.
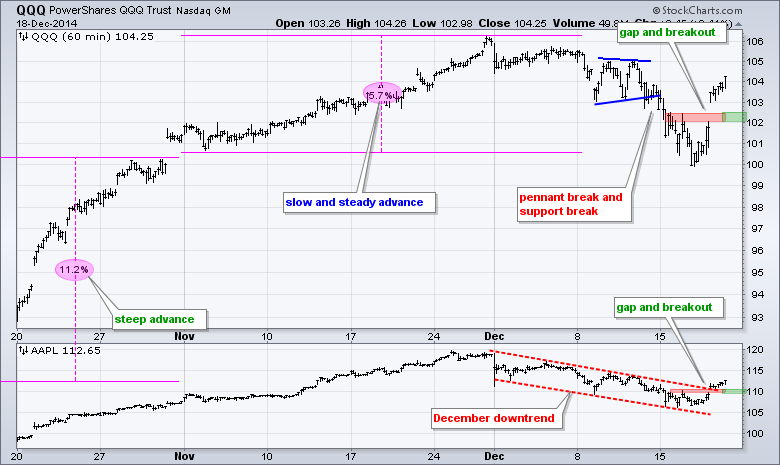
- QQQ broke out with a gap and the breakout is valid as long as 101.9 holds.
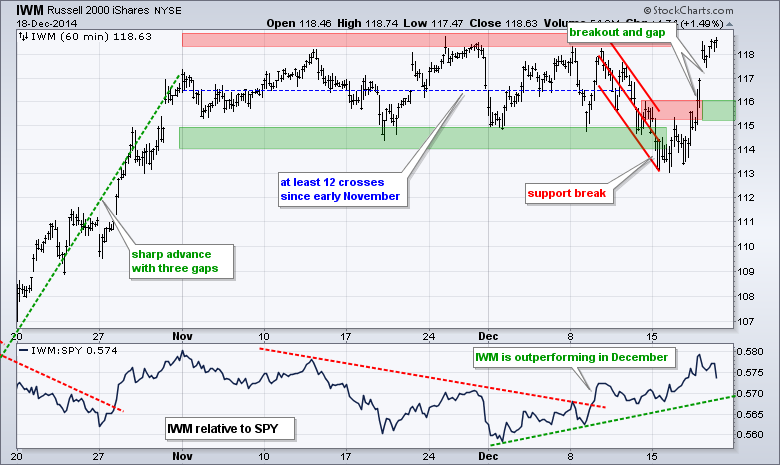
- IWM broke out a day before QQQ and SPY, and this breakout is valid as long as 115 holds.
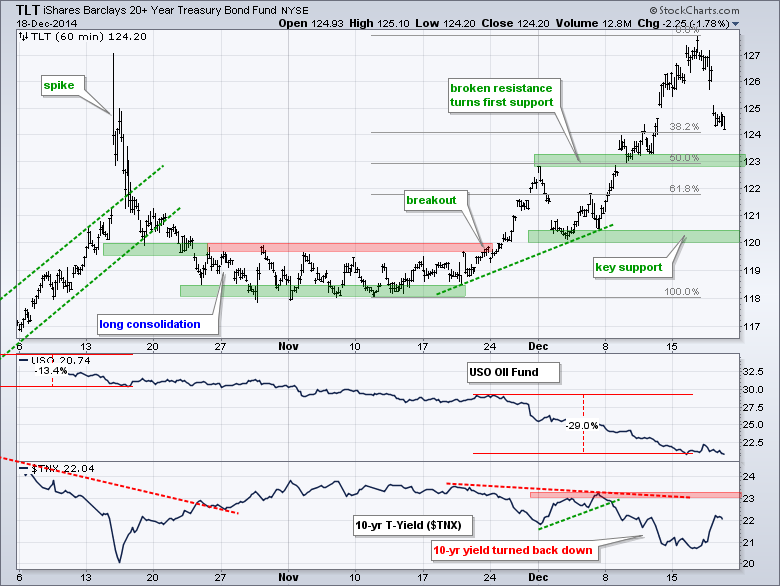
- TLT fell sharply, but the bigger trend is up with first support in the 123 area.
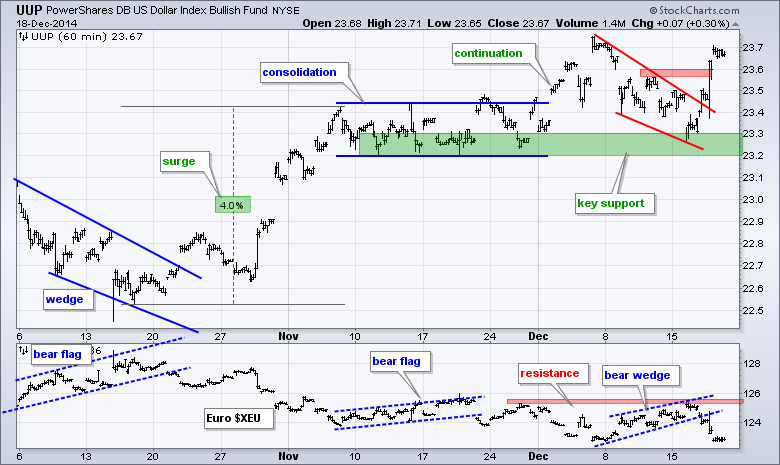
- UUP got a wedge breakout and the Euro got a wedge break down to continue their respective trends.
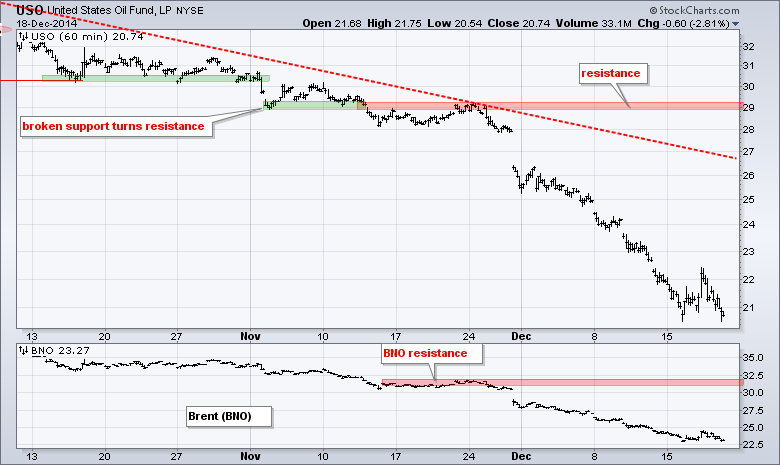
- USO remains in a strong downtrend.
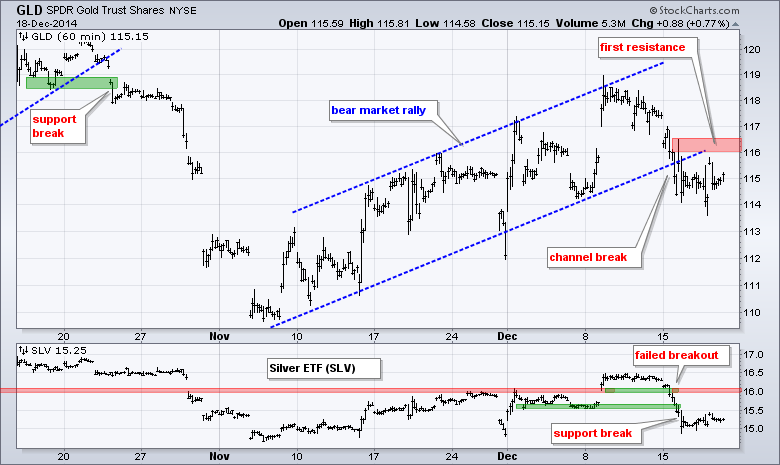
- GLD broke channel support earlier this week and the support break turns first resistance in the 116-116.5 area.
The March E-mini S&P 500 (^ESH15) broke out and never looked back. Even though this pullback overshot my initial support level around 2000, it was always viewed as a pullback within a bigger uptrend. I would consider this breakout valid as long as 2000 holds.
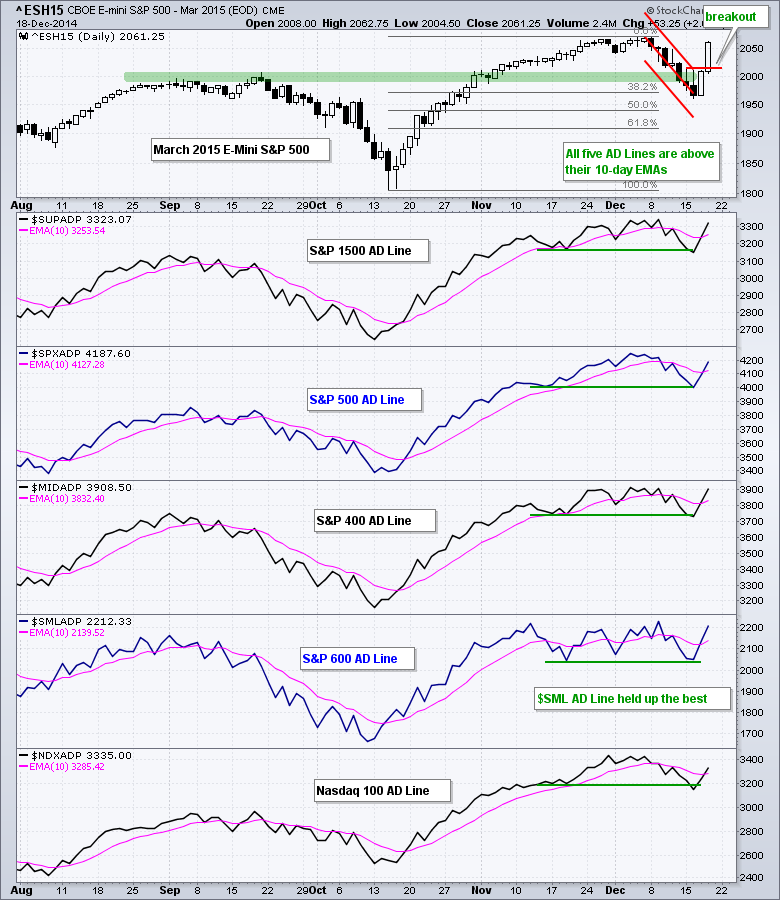
All five AD Lines are above their 10-day EMAs and four of the five are above last Thursday's highs. The Nasdaq 100 AD Line is dragging its feet a bit, while the S&P Small-Cap 600 AD Line is leading. The small-cap AD Line was the only one to hold its mid November low and is close to a significant breakout.
Four of the five risk indicators are bullish. Stocks are outperforming bonds again as the SPY:IEF surged over the last two days. The High-Yield Bond ETF (HYG) also surged, but I am not ready to turn positive on junk bonds because HYG has been underperforming LQD since the second week of November.
SPY gapped above resistance and broke out with a strong move. There is a bogus spike above 212, but all the data vendors seem to have it. I would not worry about it, unless of course your buy order was filled above 212. At this point, it is important that the gap and breakout hold. A move back below 201.8 would negate this breakout and call for a reassessment.
**************************************************************
QQQ broke out with a gap and surge above 103. This gap is bullish as long as it remains unfilled. A move below 101.8 would fill the gap and suggest that the breakout has failed. Apple also broke out with a gap and I would mark first support at 109.
**************************************************************
Large-caps took the lead on Thursday, but this did not stop IWM from moving higher and challenging the November highs. I am hesitant to call this resistance, but IWM is based on an index with over 2000 moving parts (stocks). In any case, the breakout is there and it is important that it hold. A move below 115 would negate it and call for a reassessment.
**************************************************************
The 20+ YR T-Bond ETF (TLT) tumbled with its sharpest two-day decline of the year. The overall trend is up, but TLT was quite extended after hitting a new high and ripe for a pullback or consolidation. The 50% retracement and broken resistance mark first support in the 123 area. The early December lows mark key support in the 120 area.
**************************************************************
No change. The US Dollar ETF (UUP) held support and surged above resistance at 23.6 to signal a continuation of the uptrend. This move reinforces support in the 23.2-23.3 area. The Euro Index ($XEU) failed at resistance and broke wedge support with a sharp decline. Resistance is marked at 125.50
**************************************************************
No change. The USO Oil Fund (USO) remains in a strong downtrend.
**************************************************************
No change. The Gold SPDR (GLD) had a flag working last week and had every chance to breakout, but did not and moved sharply lower on Monday. This move broke the lower trend line of a rising channel and erased last week's surge. With the bigger trend down, this looks like a continuation breakdown and a move to new lows is expected.
***************************************************************
Key Reports and Events (all times Eastern):
Fri - Dec 18 - 08:00 - TGIF
Charts of Interest are on Tuesdays and Thursdays.
This commentary and charts-of-interest are designed to stimulate thinking. This analysis is not a recommendation to buy, sell, hold or sell short any security (stock ETF or otherwise). We all need to think for ourselves when it comes to trading our own accounts. First, it is the only way to really learn. Second, we are the only ones responsible for our decisions. Think of these charts as food for further analysis. Before making a trade, it is important to have a plan. Plan the trade and trade the plan. Among other things, this includes setting a trigger level, a target area and a stop-loss level. It is also important to plan for three possible price movements: advance, decline or sideways. Have a plan for all three scenarios BEFORE making the trade. Consider possible holding times. And finally, look at overall market conditions and sector/industry performance.


