Stocks rebounded with small-caps leading the way. SPY and QQQ finished with modest gains, while IWM jumped 1.2%. Despite one day of relative strength, small-caps still lag their large-cap brethren over the last few weeks. All nine sector SPDRs were up with finance, energy and healthcare leading. An oversold bounce in the Regional Bank SPDR (KRE) helped the finance sector. Semis were strong as the Semiconductor SPDR (XSD) gained over 1% on the heels of a takeover by Cypress Semi (CY), which surged 14.29% on the news. The takeover target, Spansion (CODE), jumped 21.93%. Elsewhere, it is a big day for economic numbers because we get ISM Services, the ADP Employment Report and the Fed's Beige Book.
**This chart analysis is for educational purposes only, and should not
be construed as a recommendation to buy, sell or sell-short said securities**
Short-term Overview (Wednesday, 3-December-2014):
- There are some negatives out there, but the majority of indicators are still positive for stocks.
- Four of the five AD Lines are in uptrends (the small-cap AD Line is the only negative).
- The risk-on risk-off picture remains mixed, very mixed.
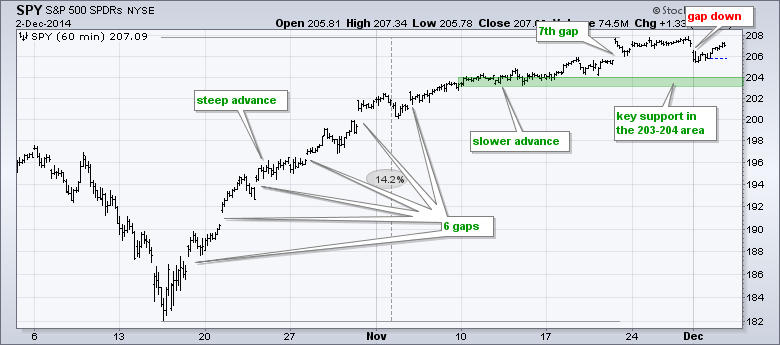
- SPY remains in a short-term uptrend with support in the 203-204 area.
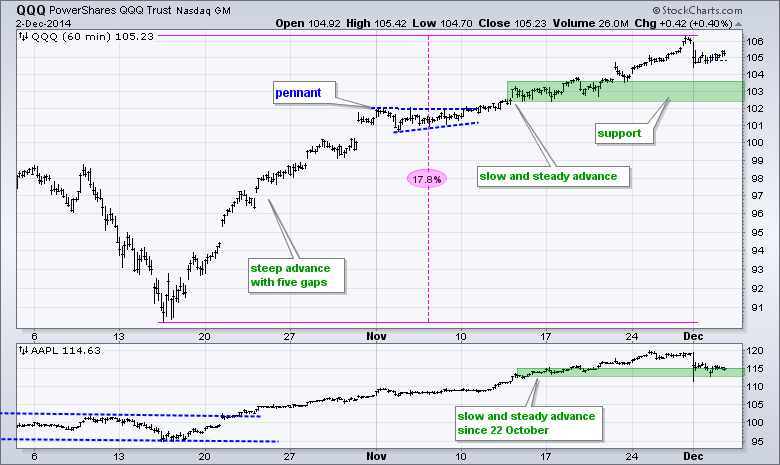
- QQQ remains in an uptrend with support in the 102.5-103.5 area.
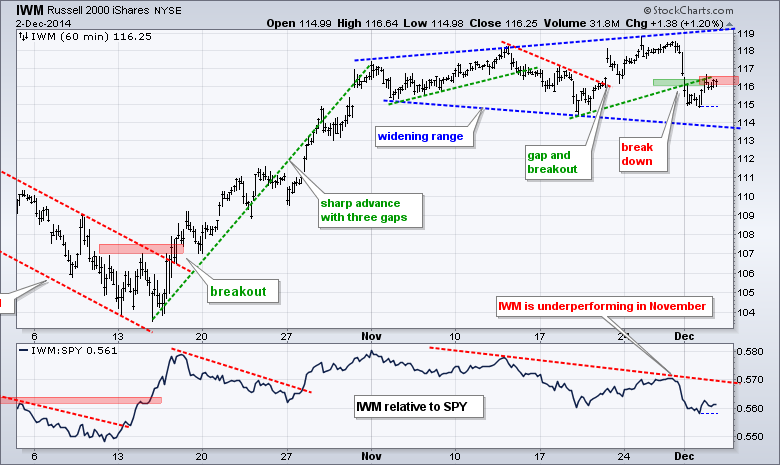
- IWM broke upswing support at 116 on 1-Dec and resistance is set at 116.5.
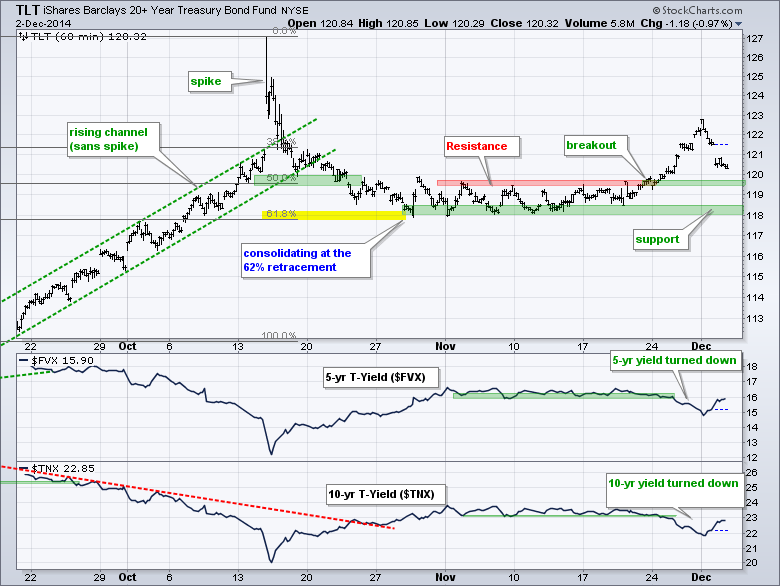
- TLT broke out at 120 on 21-Nov and is poised to test this breakout as the employment indicators hit the tape.
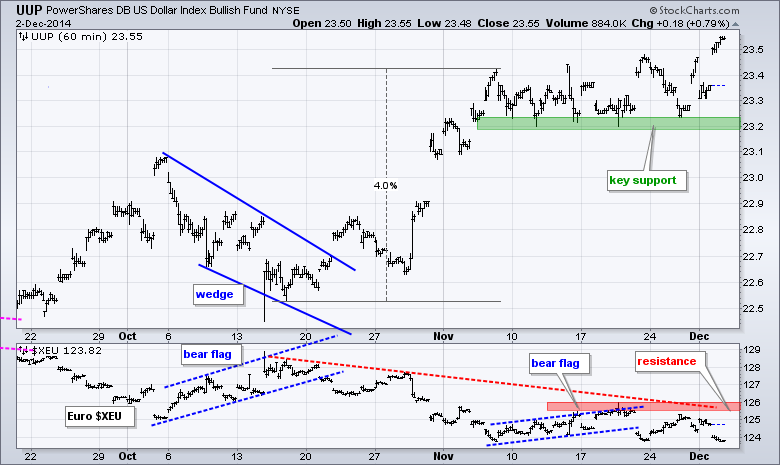
- UUP hit a new high as the Euro fell sharply on Tuesday.
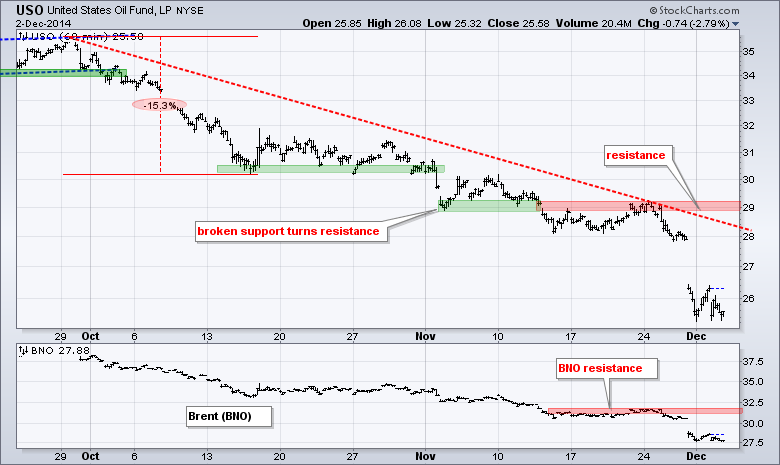
- USO firmed the last two days, but remains in a clear downtrend.
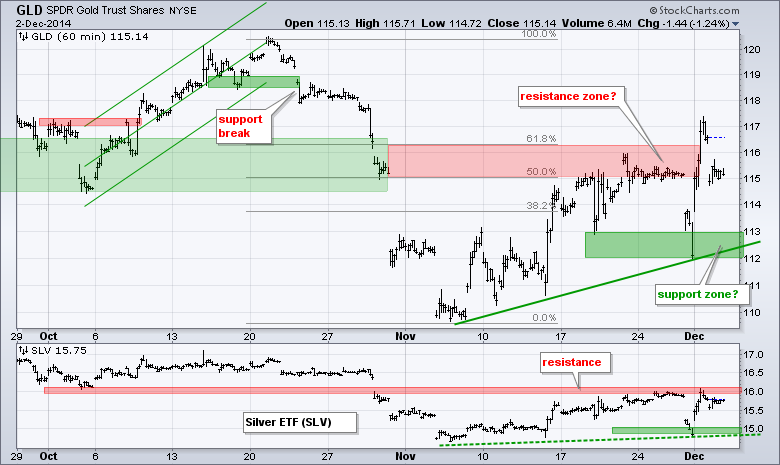
- GLD is in the midst of a volatile upswing, but remains way too erratic for my taste.
The December E-mini S&P 500 (^ESZ14) fell for two days and then bounced with a move back above 2060. I am leaving key support in the 2020-2040 area.
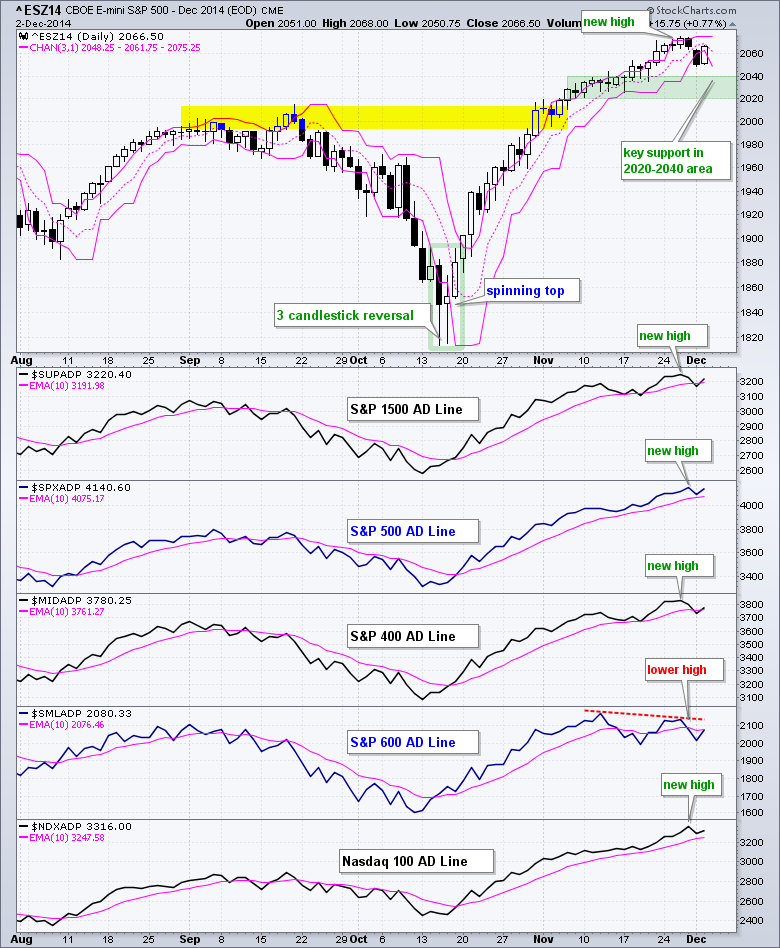
Four of the five AD Lines are in uptrends with the AD Lines for the S&P 500 and Nasdaq 100 showing the most strength. The S&P MidCap 400 AD Line is a little less strong, while the S&P Small-Cap 600 AD Line weakened with a lower high last week.
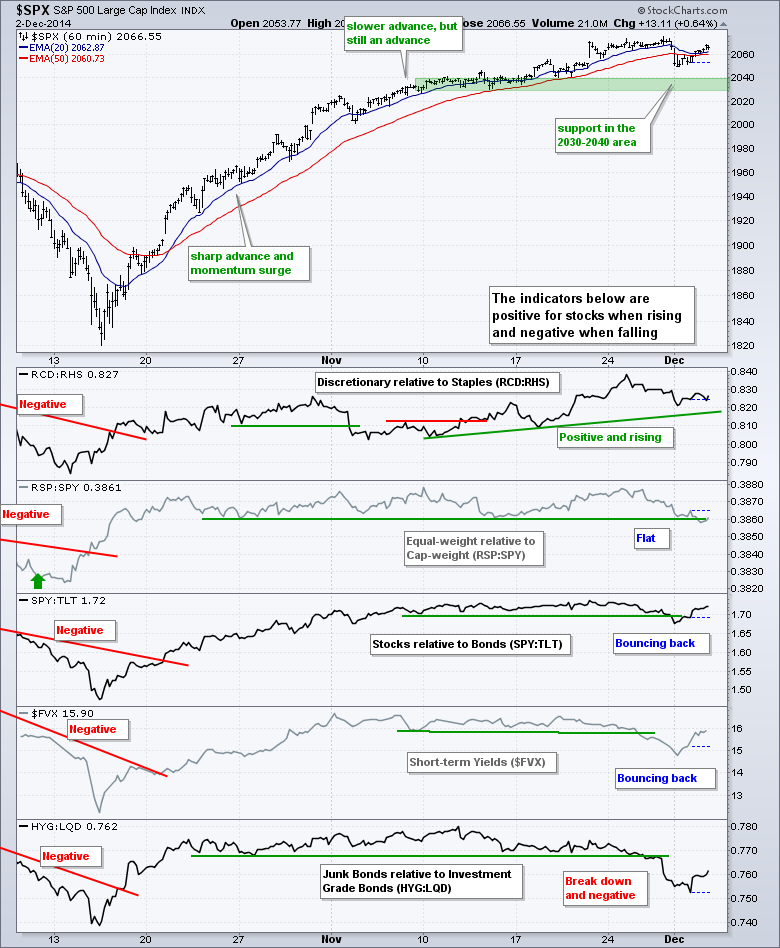
The risk indicators are quite mixed right now. At this stage, I would consider this mixed picture to be neutral and not yet bearish. Of note, the SPY:TLT ratio turned down last week, but got a bounce as the 20+ YR T-Bond ETF (TLT) fell the last two days. Also notice that the 5-year Treasury Yield ($FVX) bounced, which means 5-year T-notes declined. This is potentially positive for stocks because money moving out of Treasuries could find its way into the stock market.
No change. The S&P 500 SPDR (SPY) gapped up for the seventh time on 21-Nov, stalled and then gapped down on Monday. The 21-Nov gap has been filled and Monday's gap held. While this is negative, it is not enough to reverse the slow uptrend that began in November. Again, I think the bigger trend is up and this means I am looking for a place to bounce, not a place to break. Key support remains in the 203-204 area.
**************************************************************
No change. QQQ fell sharply as Apple weighed with a 3+ percent decline. This decline, however, is not enough to alter the November advance. Even though another shoe could drop, I would expect support and a bounce in the 102.5-103.5 area. The mid November consolidation marks support here. Note that Apple is already at the upper end of its support zone.
**************************************************************
No change. IWM reversed its upswing with a sharp decline below 116. Even though IWM is now in a down swing, the stock market overall is in an uptrend and IWM has a habit of bouncing right after a sharp decline. It is also possible that the November lows mark support. A quick move back above 116.5 would negate this support break. The indicator window shows IWM underperforming SPY.
**************************************************************
The 20+ YR T-Bond ETF (TLT) fell rather sharply the last two days and neared its breakout zone, which becomes first support. As much as I hate to use the mid October spike above 127, it does fit quite well when using the Fibonacci Retracements Tool. Notice that the current bounce retraced 50-62% of the prior decline. I am not ready to negate the breakout in TLT just yet though and this would require a move below 119.5. The employment indicators start hitting the tape today with the ADP Report. Thursday we will get Initial Jobless Claims and Friday is non-farm payrolls.
**************************************************************
The US Dollar ETF (UUP) toyed with support for a few weeks and then surged to new highs this week. The big trend has been up for a long time and the new high simply affirms this uptrend. The November lows mark key support in the 23.2 area. The Euro Index ($XEU) broke flag support in mid November, bounced and moved lower again on Tuesday. Key resistance is set at 126.
**************************************************************
No change. The USO Oil Fund (USO) firmed for over a week and then plunged to new lows after the OPEC meeting. It is basically a supply issue because OPEC kept its quotas, fracking continues and Iran may even increase production in the coming months if talks progress. USO is once again oversold, but still in a clear downtrend with resistance marked in the 29 area.
**************************************************************
No clue. Those two words sum up my feelings on gold.
***************************************************************
Key Reports and Events (all times Eastern):
Wed - Dec 03 - 07:00 - MBA Mortgage Index
Wed - Dec 03 - 08:15 - ADP Employment Report
Wed - Dec 03 - 10:00 - ISM Services Index
Wed - Dec 03 - 10:30 - Crude Oil Inventories
Wed - Dec 03 - 14:00 - Fed's Beige Book
Thu - Dec 04 - 07:30 - Challenger Job Report
Thu - Dec 04 - 08:30 - Initial Jobless Claims
Thu - Dec 04 - 10:30 - Natural Gas Inventories
Fri - Dec 05 - 08:30 - Employment Report
Fri - Dec 05 - 10:00 - Factory Orders
Fri - Dec 05 - 15:00 - Consumer Credit
Charts of Interest are on Tuesdays and Thursdays.
This commentary and charts-of-interest are designed to stimulate thinking. This analysis is not a recommendation to buy, sell, hold or sell short any security (stock ETF or otherwise). We all need to think for ourselves when it comes to trading our own accounts. First, it is the only way to really learn. Second, we are the only ones responsible for our decisions. Think of these charts as food for further analysis. Before making a trade, it is important to have a plan. Plan the trade and trade the plan. Among other things, this includes setting a trigger level, a target area and a stop-loss level. It is also important to plan for three possible price movements: advance, decline or sideways. Have a plan for all three scenarios BEFORE making the trade. Consider possible holding times. And finally, look at overall market conditions and sector/industry performance.


