Stocks continued higher on Wednesday with small-caps leading for the second day running. Seven of nine sector SPDRs were higher with industrials, energy and materials leading. Energy is getting an oversold bounce, while industrials are showing some leadership as XLI nears a 52-week high. Tech stocks were helped with strength in semis as the Semiconductor SPDR (XSD) surged 2.5% and neared its September high. It is hard to argue with leadership in industrials and semiconductors. On the economic front, ADP Employment rose 208,000 in November, which was below expectations of 227,000. A 200,000 plus gain, however, is nothing to sneeze at. The ISM Services Index surged to 59.7 and exceeded expectations. This goes with a strong ISM Manufacturing report on Monday and shows broad strength in the economy.
**This chart analysis is for educational purposes only, and should not
be construed as a recommendation to buy, sell or sell-short said securities**
Short-term Overview (Thursday, 4-December-2014):
- The positives still outweigh the negatives for the stock market.
- Three of the five AD Lines hit new highs on Wednesday.
- Consumer discretionary continues to outperform consumer staples.
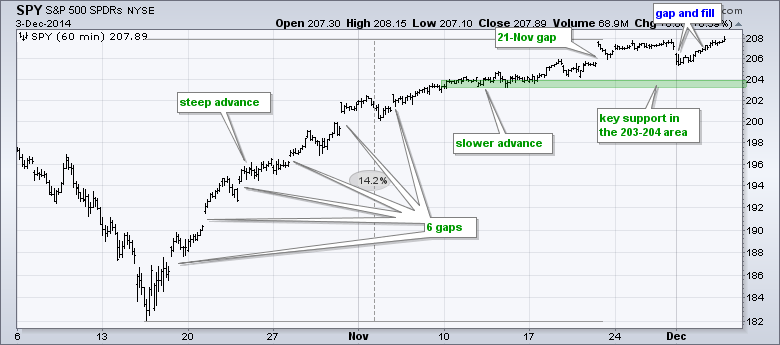
- SPY remains in a short-term uptrend with support in the 203-204 area.
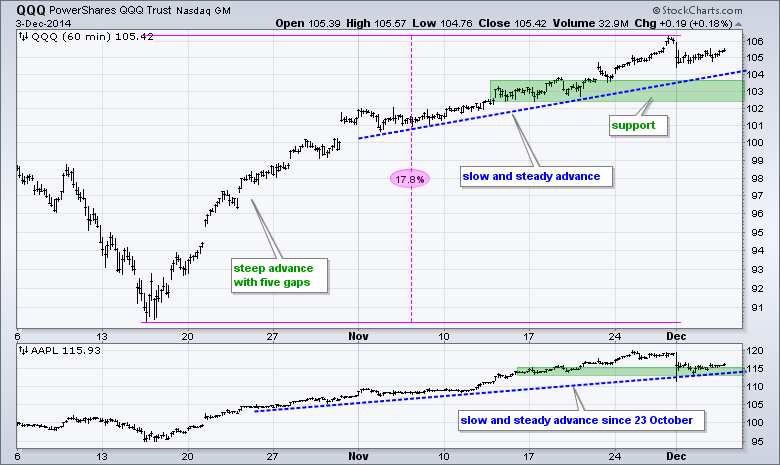
- QQQ remains in an uptrend with support in the 102.5-103.5 area.
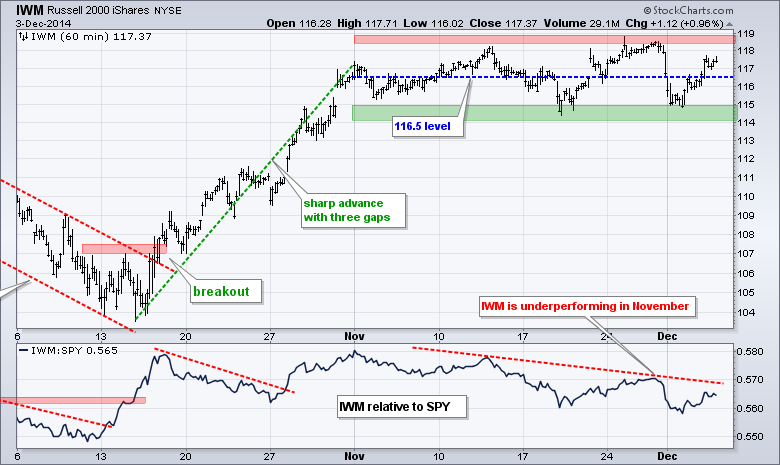
- IWM has been range bound since early November, but in an upswing within this range.
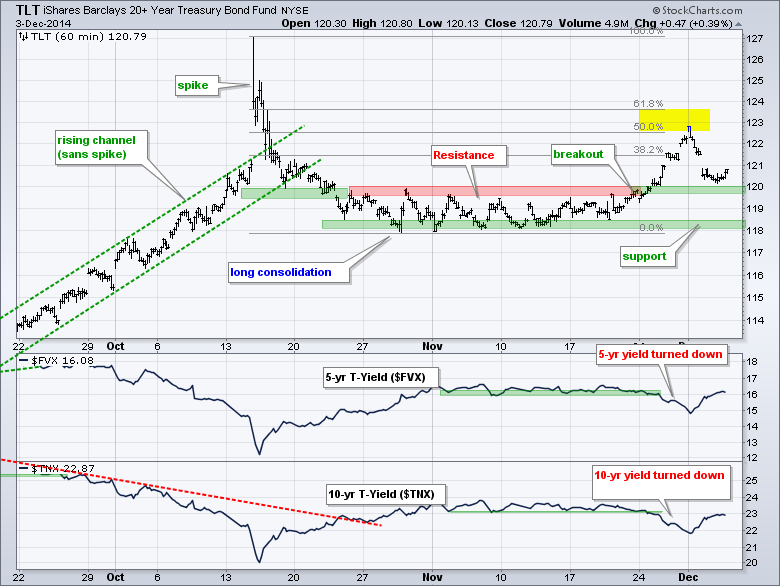
- TLT broke out at 120 on 21-Nov and is testing this breakout.
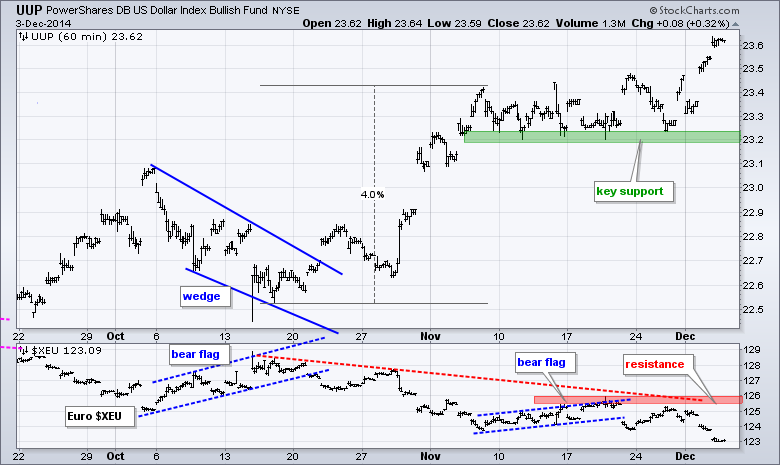
- UUP hit a new high on Wednesday and the Euro continued lower ahead of today's European Central Bank meeting.
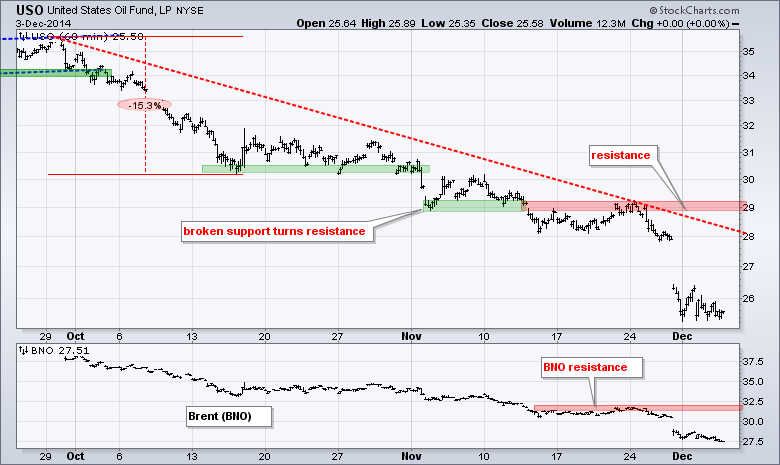
- USO firmed the last few days, but remains in a clear downtrend.
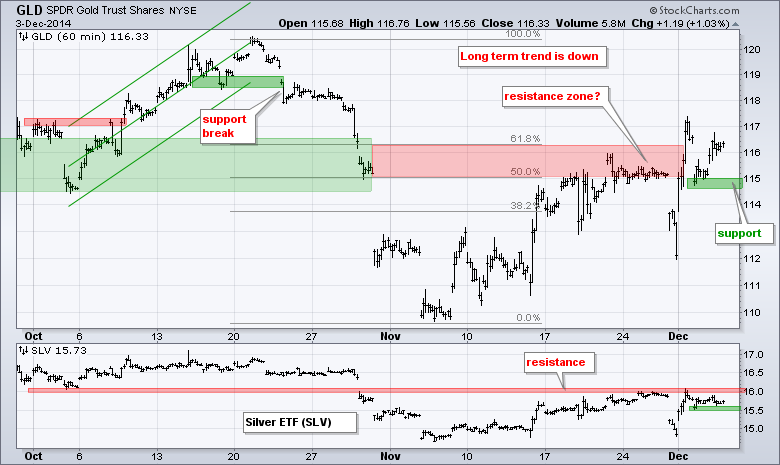
- GLD remains in an upswing, but it still looks like a bear mark bounce.
The December E-mini S&P 500 (^ESZ14) is back near last week's highs and still in a short-term uptrend. Even though we could use Monday's low to mark key support, I will leave key support in the 2020-2040 area because the bigger trend is up and pullbacks are viewed as corrections that will likely entice buyers.
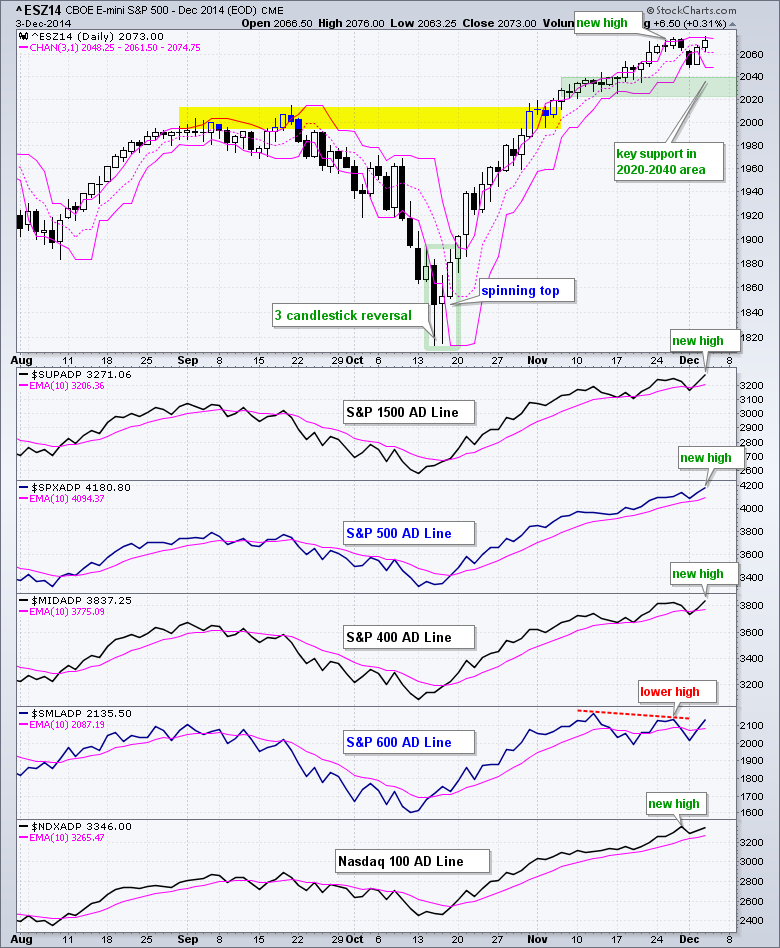
The AD Lines for the S&P 1500, S&P 500 and S&P MidCap 400 moved to new highs. The S&P Small-Cap 600 got a nice bounce over the last two days, but remains below its prior highs. The Nasdaq 100 AD Line also bounced, but remains just below last week's high. Despite weakness in the S&P Small-Cap 600 AD Line, the new highs in three AD Lines indicate that stock market breadth is bullish overall.
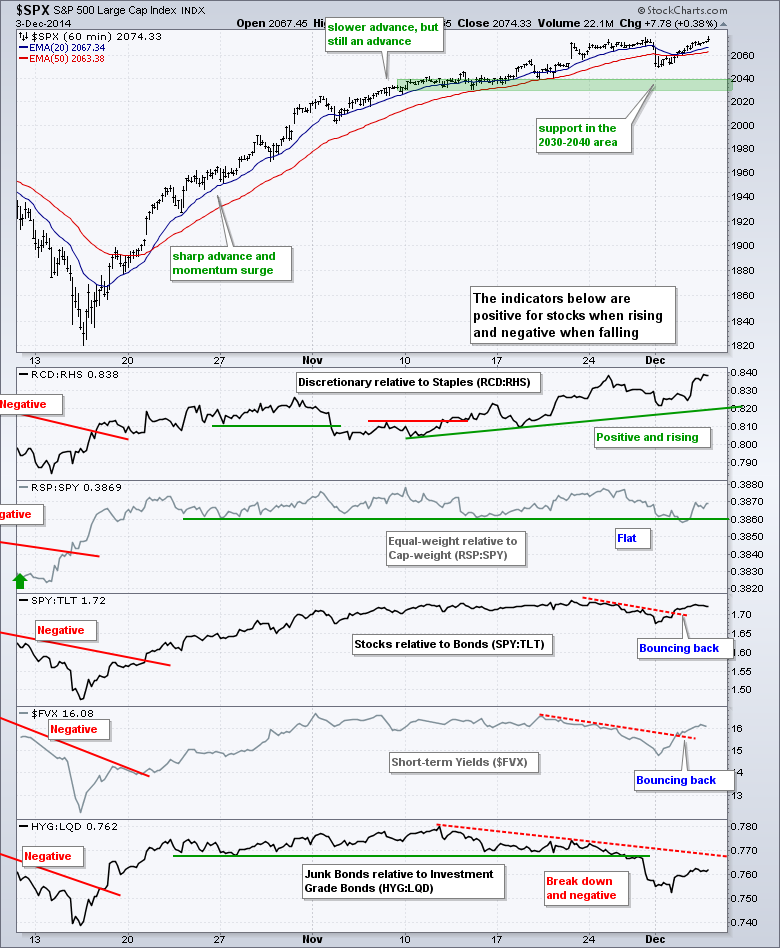
The risk indicators remain mixed, but there was some improvement over the last few days. Namely, SPY outperformed TLT the last three days and the 5-year Treasury Yield moved back above 1.6%. Money moved out of Treasuries this week and this is positive for stocks. The economic and labor indicators are mostly positive and the bond market is waiting on Friday's employment report.
SPY gapped down on Monday and actually filled the 21-Nov gap above 206. Monday's gap did not last long as the ETF worked its way back to 208 and hit a new high intraday. I could mark support at 205, but will leave key support in the 203-204 area to allow for a buffer in the strong uptrend.
**************************************************************
QQQ has turned rather boring this week with a tight range around the 105 area. Blame Apple, which has traded in the 115 area for most of the last three days. The QQQ trend remains up and we are seeing upside leadership from semiconductors, which is positive for the tech sector. I am leaving key support in the 102.5-103.5 area for now.
**************************************************************
IWM remains a challenge because it is simply bouncing within a trading range. The ETF has crossed the 116.5 level at least six times in the last five weeks. With a bounce off the late November low, the ETF is in the midst of another upswing. However, IWM continues to underperform SPY and IWM is not the vehicle of choice for the current uptrend in stocks.
**************************************************************
No change. The 20+ YR T-Bond ETF (TLT) fell rather sharply on Monday-Tuesday and neared its breakout zone, which becomes first support. As much as I hate to use the mid October spike above 127, it does fit quite well when using the Fibonacci Retracements Tool. Notice that the current bounce retraced 50-62% of the prior decline. I am not ready to negate the breakout in TLT just yet though and this would require a move below 119.5. The employment indicators start hitting the tape today with the ADP Report. Thursday we will get Initial Jobless Claims and Friday is non-farm payrolls.
**************************************************************
No change. The US Dollar ETF (UUP) toyed with support for a few weeks and then surged to new highs this week. The big trend has been up for a long time and the new high simply affirms this uptrend. The November lows mark key support in the 23.2 area. The Euro Index ($XEU) broke flag support in mid November, bounced and moved lower again on Tuesday. Key resistance is set at 126.
**************************************************************
No change. The USO Oil Fund (USO) firmed for over a week and then plunged to new lows after the OPEC meeting. It is basically a supply issue because OPEC kept its quotas, fracking continues and Iran may even increase production in the coming months if talks progress. USO is once again oversold, but still in a clear downtrend with resistance marked in the 29 area.
**************************************************************
Gold remains very volatile and risky, but the long-term trend is still down. This means I am inclined to look for peaks and bearish reversals, not breakouts and extended advances. The current advance retraced just over 62% with the move to 116. With a bounce on Wednesday, I am marking first support at 114.50 and a break below this level would reverse the current upswing.
***************************************************************
Key Reports and Events (all times Eastern):
Thu - Dec 04 - 07:30 - Challenger Job Report
Thu - Dec 04 - 08:00 - European Central Bank Meeting
Thu - Dec 04 - 08:30 - Initial Jobless Claims
Thu - Dec 04 - 10:30 - Natural Gas Inventories
Fri - Dec 05 - 08:30 - Employment Report
Fri - Dec 05 - 10:00 - Factory Orders
Fri - Dec 05 - 15:00 - Consumer Credit
Charts of Interest are on Tuesdays and Thursdays.

This commentary and charts-of-interest are designed to stimulate thinking. This analysis is not a recommendation to buy, sell, hold or sell short any security (stock ETF or otherwise). We all need to think for ourselves when it comes to trading our own accounts. First, it is the only way to really learn. Second, we are the only ones responsible for our decisions. Think of these charts as food for further analysis. Before making a trade, it is important to have a plan. Plan the trade and trade the plan. Among other things, this includes setting a trigger level, a target area and a stop-loss level. It is also important to plan for three possible price movements: advance, decline or sideways. Have a plan for all three scenarios BEFORE making the trade. Consider possible holding times. And finally, look at overall market conditions and sector/industry performance.


