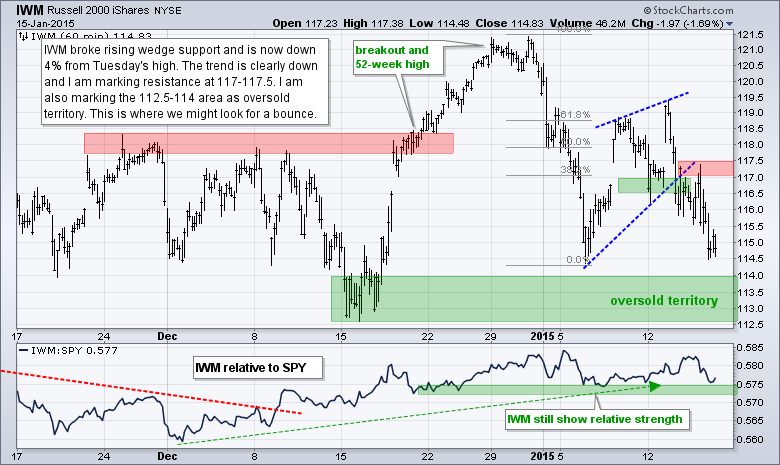
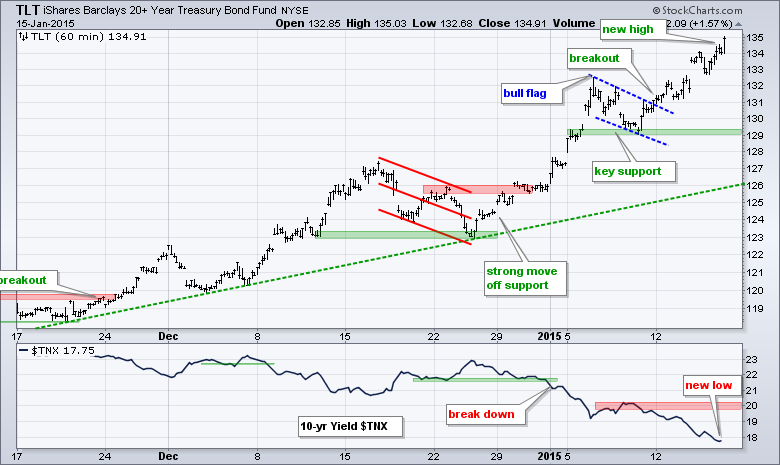
Stocks tried to bounce on Thursday, but selling pressure soon took over and the major index ETFs closed with losses again. Small-caps and large techs led the way as IWM fell 1.69% and QQQ declined 1.30%. Eight of nine sectors were down with consumer discretionary, technology, finance, energy and healthcare losing just over 1%. The Home Construction iShares (-5%) and the Retail SPDR (-2.29%) weighed on the consumer discretionary sector. Once again, money moved out of the stock market and into the Treasury bond market as TLT hit yet another new high.
**This chart analysis is for educational purposes only, and should not
be construed as a recommendation to buy, sell or sell-short said securities**
Short-term Overview (Friday, 16-January-2015):
- The five AD Lines broke below their early January lows.
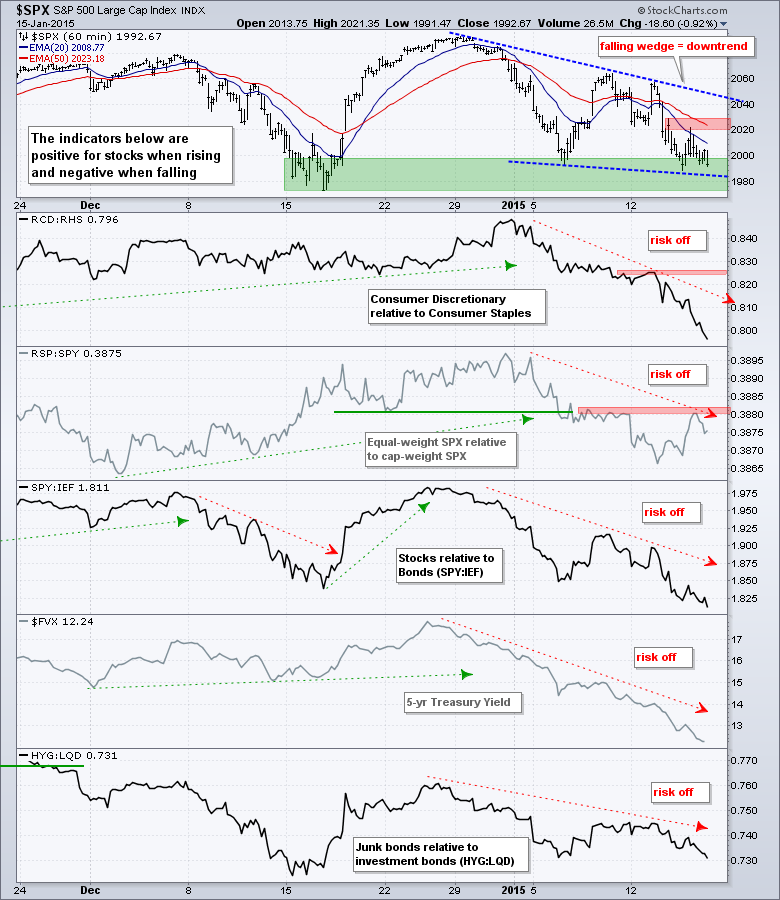
- The risk indicators remain negative overall.
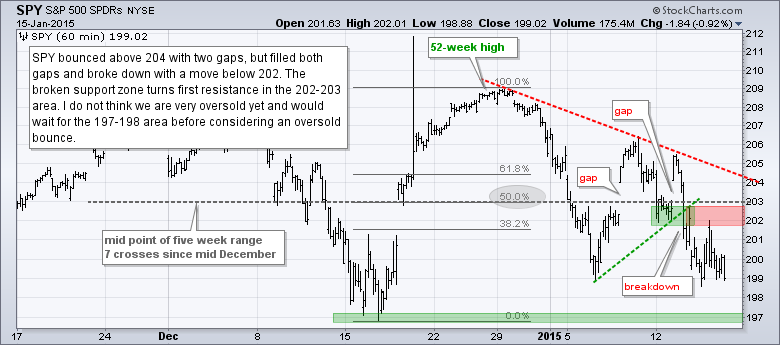
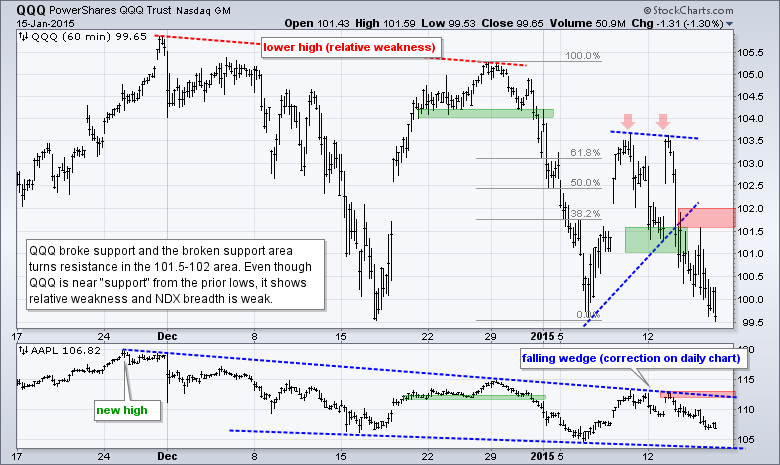
- QQQ, SPY and IWM remain in short-term downtrends and broken support zones turn first resistance.
- TLT broke flag resistance last week and hit another new high on Thursday.
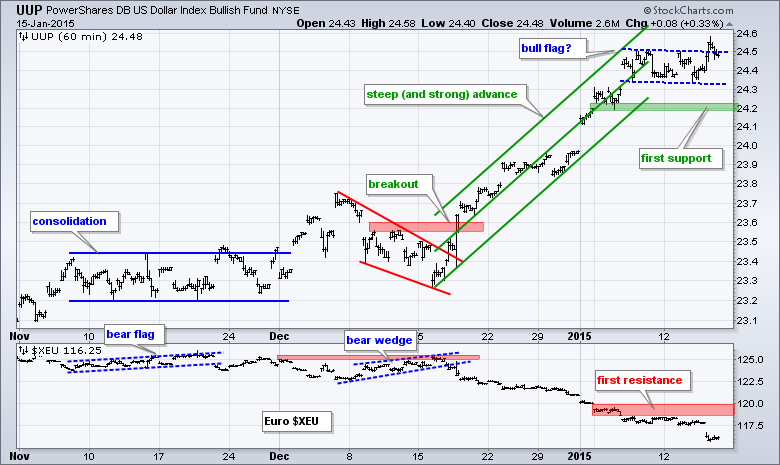
- UUP stalled over the past week, but remains in a strong uptrend overall.
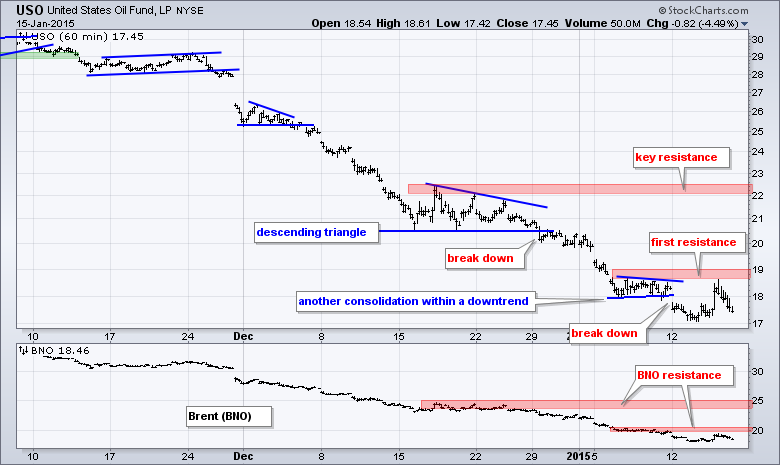
- USO pulled back after its bounce and remains in a strong downtrend.
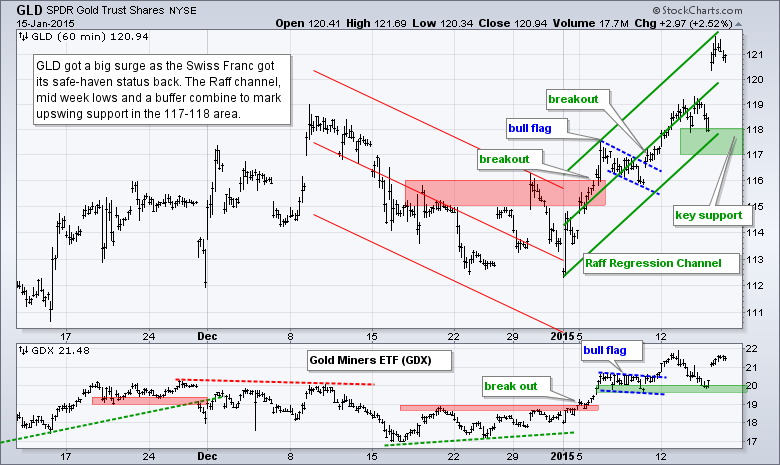
- GLD extended its short-term uptrend and I raised key support to the 117-118 area.
The E-mini tried to bounce after Wednesday's hammer, but failed yet again and closed below its early January low. This move also broke the lower trend line of a triangle. The E-mini is now down around 5.5% from high to low since late December. After new highs in December, this is still viewed as a correction within a bigger uptrend. The lower trend line of a potential channel extends to the 1950 area in 1-2 days and this area also marks a 50% retracement. A move to this area would create an oversold condition that could lead to a bounce.
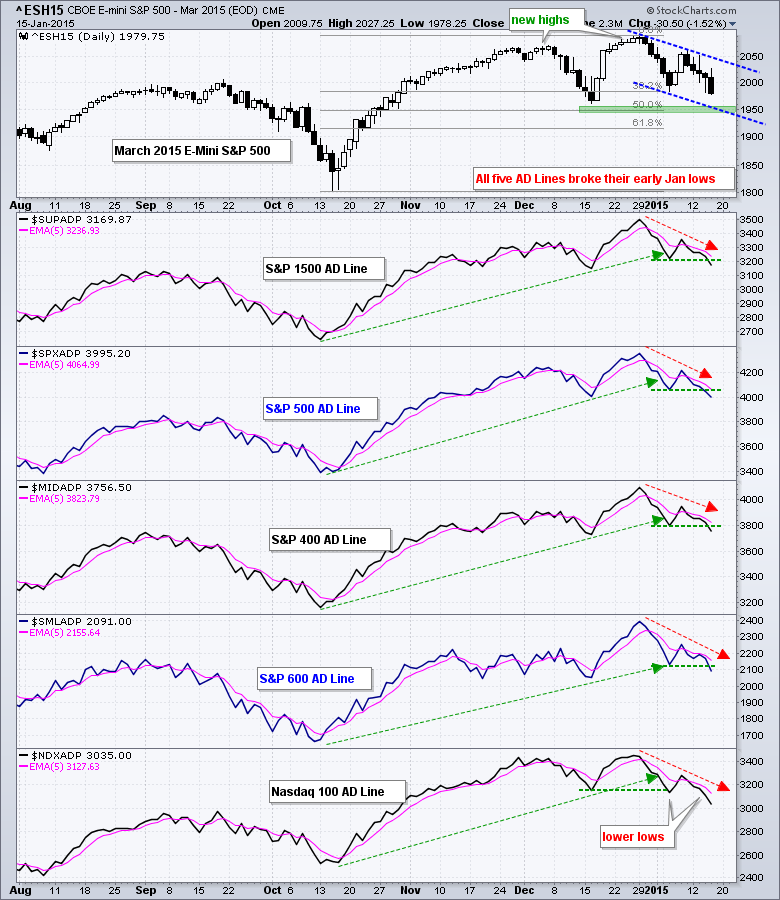
All five AD Lines are in short-term downtrends and all five broke below their early January lows. Small-caps did not hold up on this go around and the S&P Small-Cap 600 AD Line is also weak (short-term). The Nasdaq 100 AD Line remains the weakest of the five because it has two lower lows this year.
All five risk indicators are negative (risk off). The consumer discretionary sector got pummeled over the last few days and seriously underperformed the consumer staples sector, which remains one of the strongest sectors in the market (XLU is the strongest). Stocks continued to underperform bonds as the SPY:IEF ratio moved below its October low. The 5-year Treasury Yield ($FVX) continued its free fall and this is hurting the banking sector.
The bulk of the short-term evidence remains bearish for stocks. The AD Lines are in downtrends since late December, the major index ETFs broke support levels this week and the risk indicators are net negative. The finance sector and the Nasdaq 100 are showing relative weakness, and the consumer discretionary sector was hit hard this week. Even though this short-term downtrend is still considered a correction within a bigger uptrend, I do not think we have become oversold yet and this means the decline could extend. I suspect that we will get some sort of "support" break and then a bounce. For example, the S&P 500 could break below its mid December low to set up a bounce.
**************************************************************
**************************************************************
**************************************************************
**************************************************************
**************************************************************
**************************************************************
***************************************************************
Key Reports and Events (all times Eastern):
Fri - Jan 16 - 08:30 - Consumer Price Index (CPI)
Fri - Jan 16 - 09:15 - Industrial Production
Fri - Jan 16 - 09:55 - Michigan Sentiment
This commentary is designed to stimulate thinking. This analysis is not a recommendation to buy, sell, hold or sell short any security (stock ETF or otherwise). We all need to think for ourselves when it comes to trading our own accounts. First, it is the only way to really learn. Second, we are the only ones responsible for our decisions. Think of these charts as food for further analysis. Before making a trade, it is important to have a plan. Plan the trade and trade the plan. Among other things, this includes setting a trigger level, a target area and a stop-loss level. It is also important to plan for three possible price movements: advance, decline or sideways. Have a plan for all three scenarios BEFORE making the trade. Consider possible holding times. And finally, look at overall market conditions and sector/industry performance.


