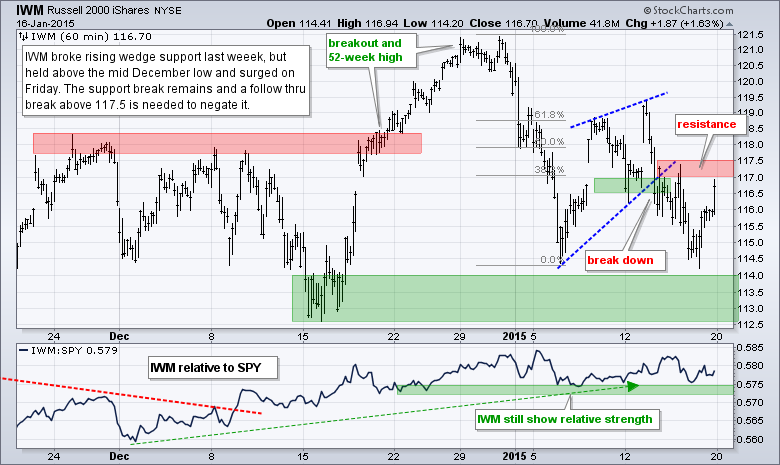
SPY, QQQ and IWM broke down last week, but rebounded sharply on Friday. Despite this rebound, the major index ETFs closed down for the week. IWM led Friday with a 1.63% advance and small-caps continue to hold up well overall. Energy led the sectors higher as XLE got a big oversold bounce. Consumer discretionary, finance and healthcare also showed some leadership with 1+ percent gains on Friday. Note that earnings season gets into swing today with dozens of reports on deck.
**This chart analysis is for educational purposes only, and should not
be construed as a recommendation to buy, sell or sell-short said securities**
Short-term Overview (Tuesday, 20-January-2015):
- The AD Lines are in three week downtrends, but four broke above their 5-day EMAs.
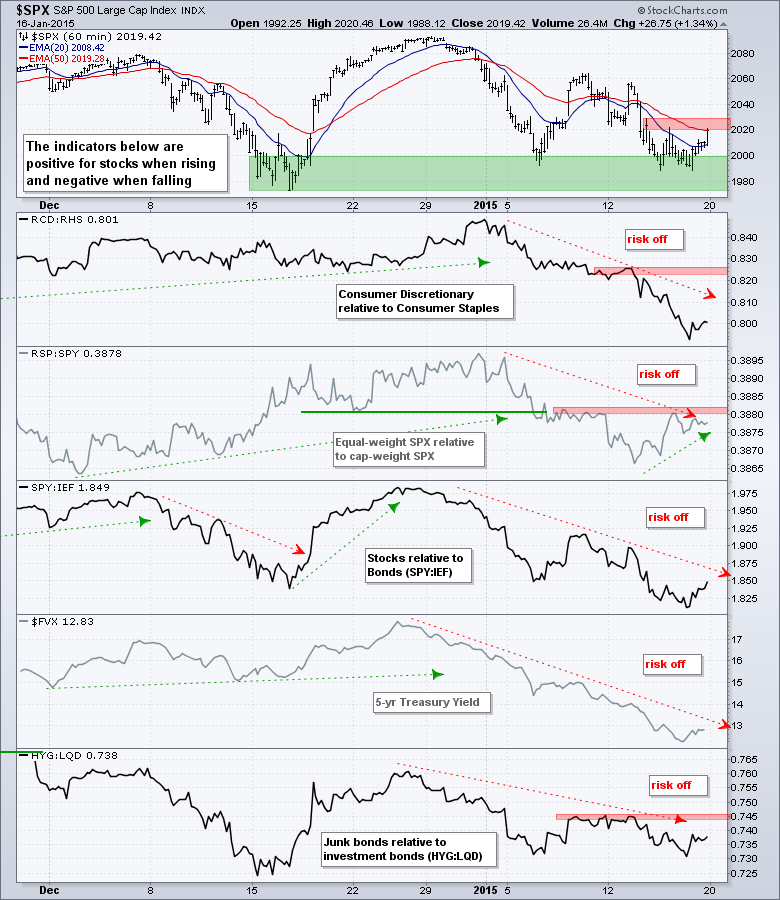
- The risk indicators remain negative overall.
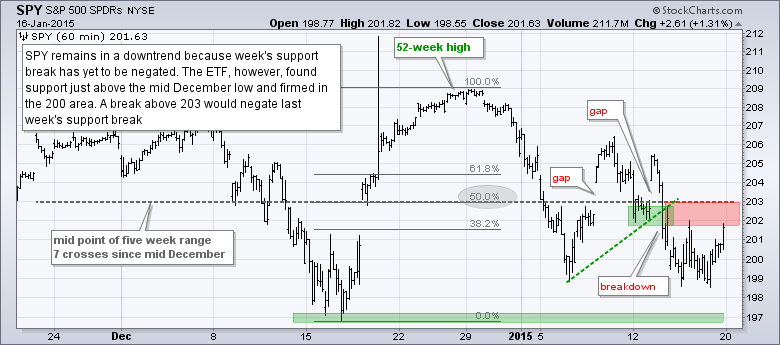
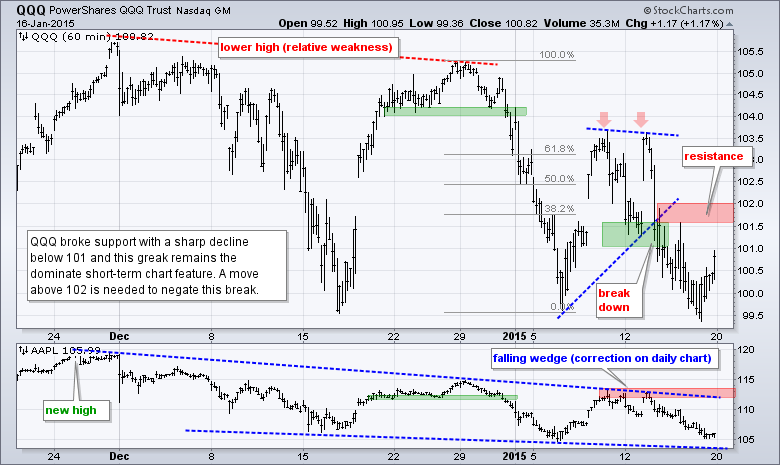
- QQQ, SPY and IWM bounced on Friday, but have yet to negate their support breaks from last week.
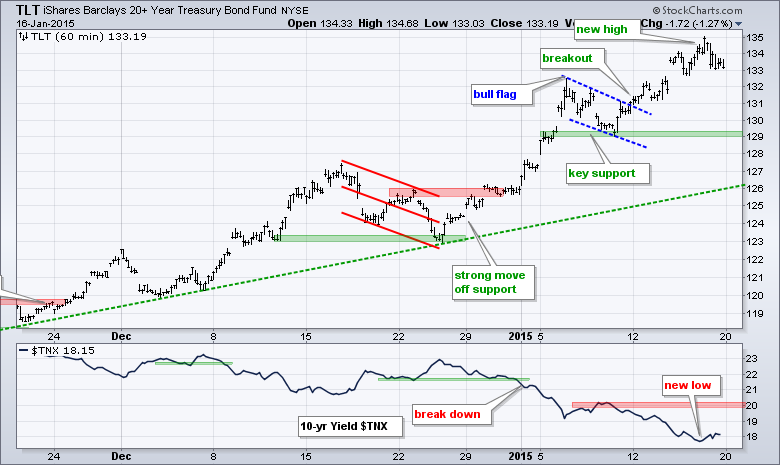
- TLT broke flag resistance last week and hit another new high on Thursday.
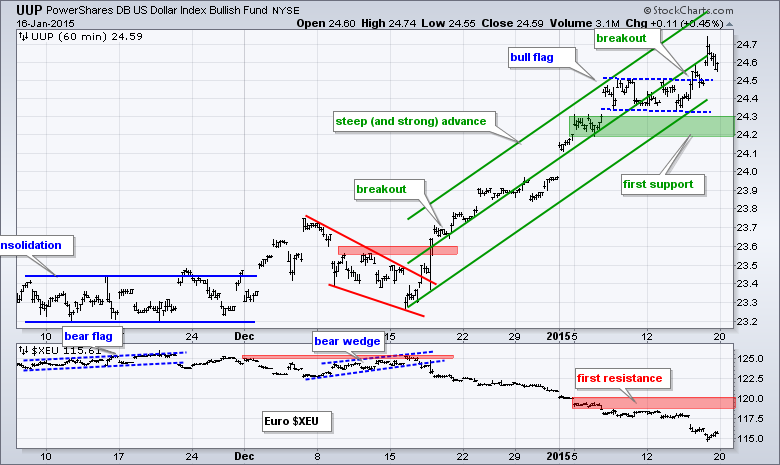
- UUP broke flag resistance and hit a 52-week high on Friday.
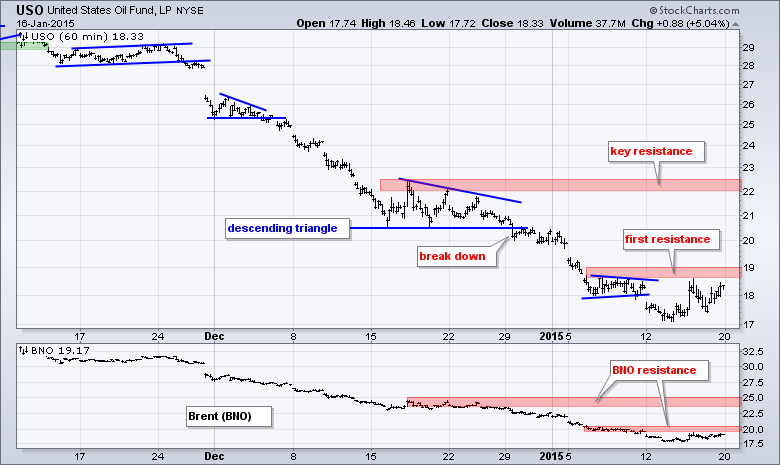
- USO got an oversold bounce last week, but is already near first resistance.
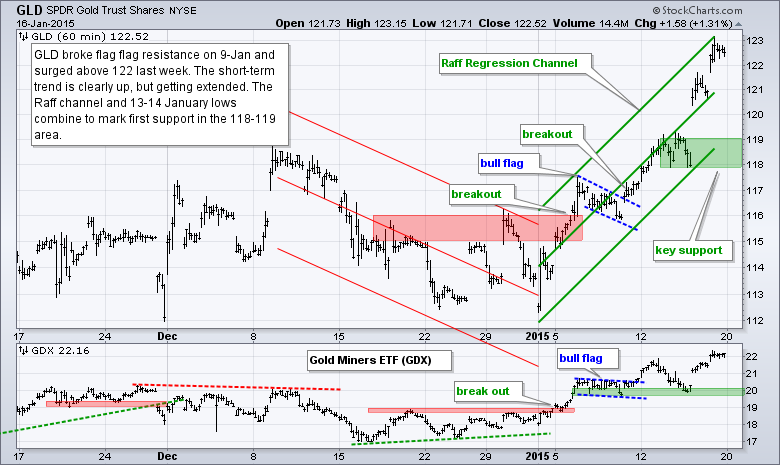
- GLD extended its short-term uptrend and I am marking support in the 118-119 area.
The E-mini continues to battle the 2000 area. Notice that the E-mini hit resistance around 2000 in September, broke through in November and then found support near 2000 in December-January. Overall, the December-January price action looks like a big consolidation after a breakout. The decline over the last few weeks formed a falling wedge and a follow through breakout would reverse the three week downtrend.
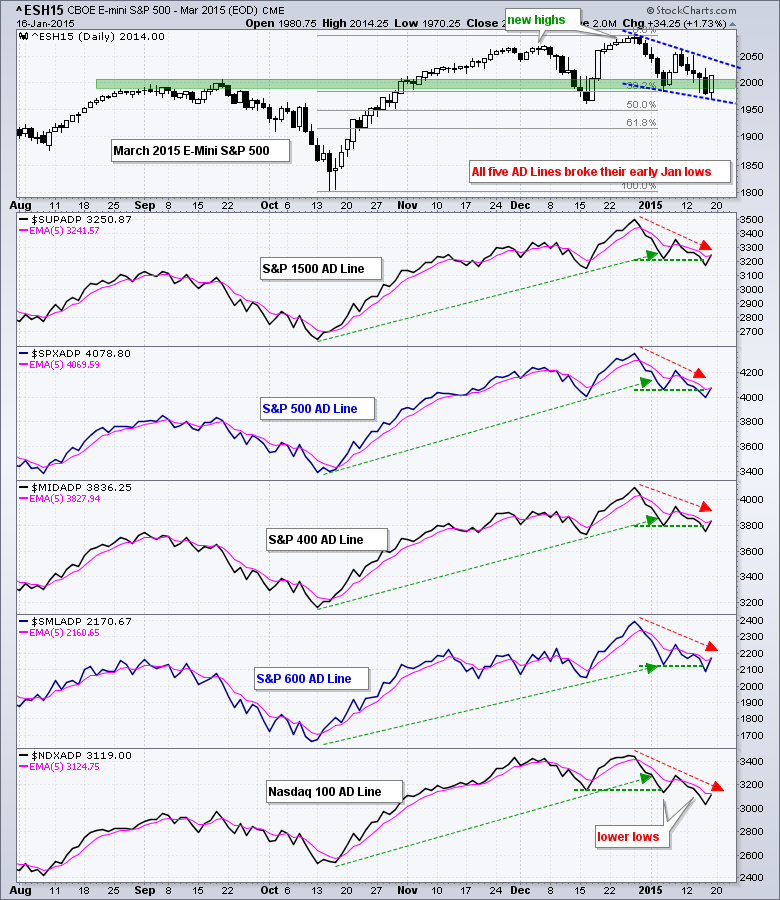
All five AD Lines turned up and four broke above their 5-day EMAs. Even though these AD Lines remain in three week downtrends, the break above the 5-day EMA is the first sign of improvement. The early January highs mark the next hurdles for the bulls.
All five risk indicators remain negative (risk off). Consumer discretionary is underperforming consumer staples. The Equal-Weight S&P 500 ETF (RSP) is underperforming the cap-weight SPY, but this indicator is showing some resilience with a bounce over the last few days. It is the closest to turning positive. SPY has underperformed the 7-10 YR T-Bond ETF (IEF) since late December. The 5-year Treasury Yield ($FVX) has fallen sharply since late December as money moved into short-term Treasury bonds. And finally, junk bonds continue to underperform investment grade bonds.
The bulk of the short-term evidence remains bearish for stocks, but keep in mind that the medium-term evidence is bullish. This means the bigger bullish trend can trump the smaller bearish trend at any moment. Furthermore, the S&P 500 is finding support in the 2000 area again. SPY, QQQ and IWM broke down last week and bounced back towards their breakout zones on Friday. The first hurdle for the bulls is to take back these support breaks, which means we need to see follow through to Friday's rebound.
**************************************************************
**************************************************************
**************************************************************
**************************************************************
**************************************************************
**************************************************************
***************************************************************
Key Reports and Events (all times Eastern):
Tue - Jan 20 - 10:00 - NAHB Housing Market Index
Wed - Jan 21 - 07:00 - MBA Mortgage Index
Wed - Jan 21 - 08:30 - Housing Starts/Building Permits
Thu - Jan 22 - 08:30 - Initial Jobless Claims
Thu - Jan 22 - 09:00 - FHFA Housing Price Index
Thu - Jan 22 - 10:30 - Natural Gas Inventories
Thu - Jan 22 - 11:00 - Oil Inventories
Fri - Jan 23 - 10:00 - Existing Home Sales
Fri - Jan 23 - 10:00 - Leading Economic Indicators
This commentary is designed to stimulate thinking. This analysis is not a recommendation to buy, sell, hold or sell short any security (stock ETF or otherwise). We all need to think for ourselves when it comes to trading our own accounts. First, it is the only way to really learn. Second, we are the only ones responsible for our decisions. Think of these charts as food for further analysis. Before making a trade, it is important to have a plan. Plan the trade and trade the plan. Among other things, this includes setting a trigger level, a target area and a stop-loss level. It is also important to plan for three possible price movements: advance, decline or sideways. Have a plan for all three scenarios BEFORE making the trade. Consider possible holding times. And finally, look at overall market conditions and sector/industry performance.
