Stocks started the day under selling pressure as the major index ETFs gapped down on the open. Selling pressure continued into the afternoon, but buyers stepped in around 2PM and pushed stocks off their lows. This bounce was too little too late because SPY did not fill its opening gap. Seven of the nine sectors were down with consumer discretionary, finance and materials leading the way. Utilities and energy bucked the selling pressure. Energy stocks are just getting an oversold bounce, but utilities remain one of the strongest sectors in the market right now. High-yielding REITs are also showing strength still. The consumer discretionary sector was hurt by weakness in retail stocks, which were hit by a worse-than-expected retail sales report. I am also concerned with relative weakness and the break downs in the banking stocks, which are being pummeled by the decline in Treasury yields.
**This chart analysis is for educational purposes only, and should not
be construed as a recommendation to buy, sell or sell-short said securities**
Short-term Overview (Thursday, 15-January-2015):
- The AD Lines are in three week downtrends and below their 5-day EMAs.
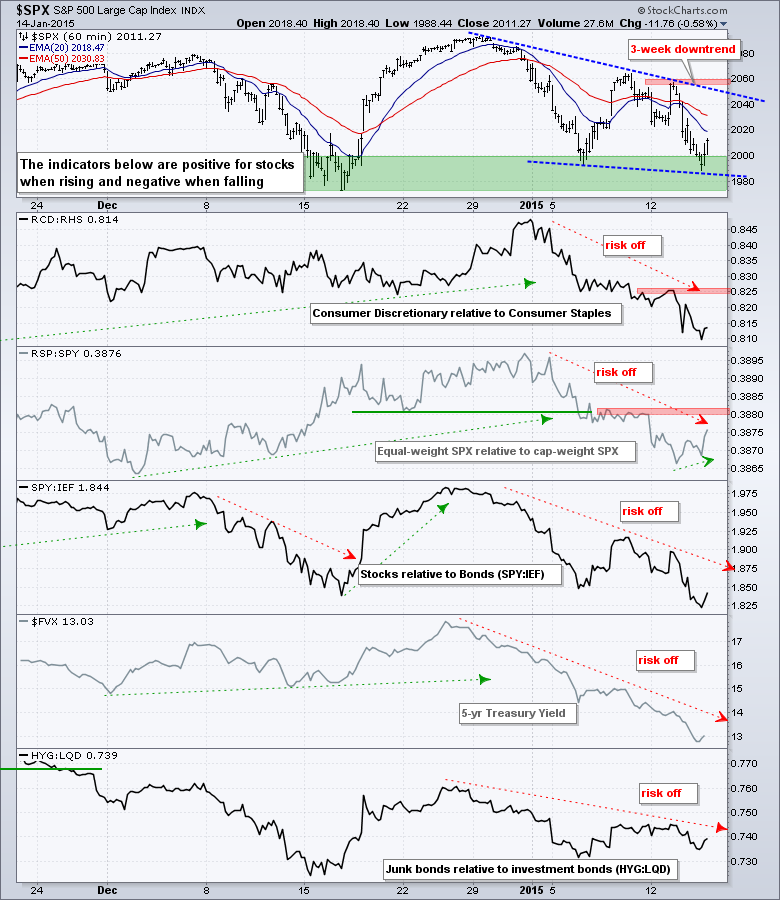
- The risk indicators remain negative overall.
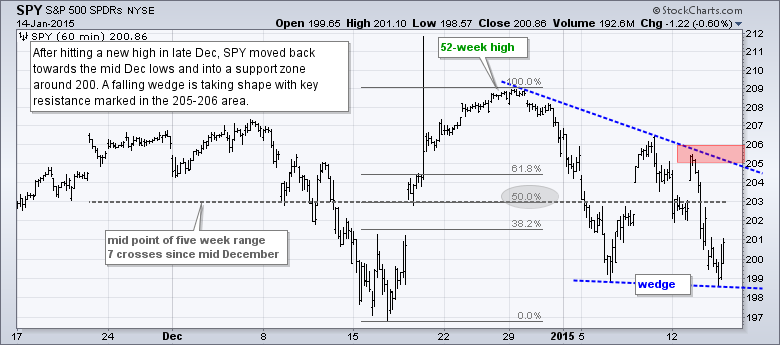
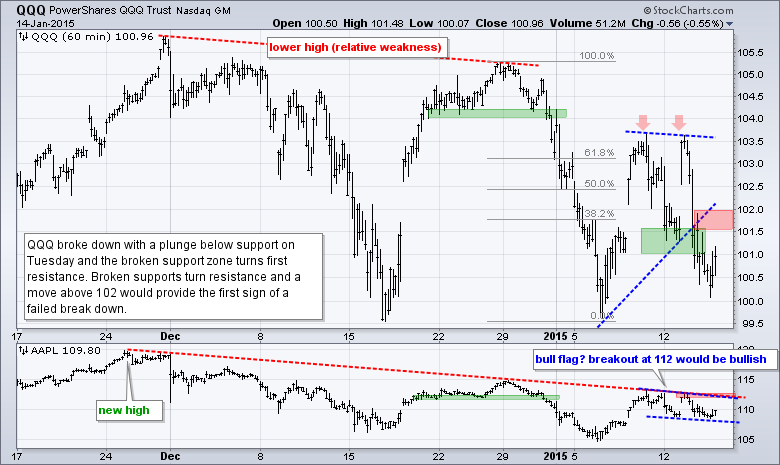
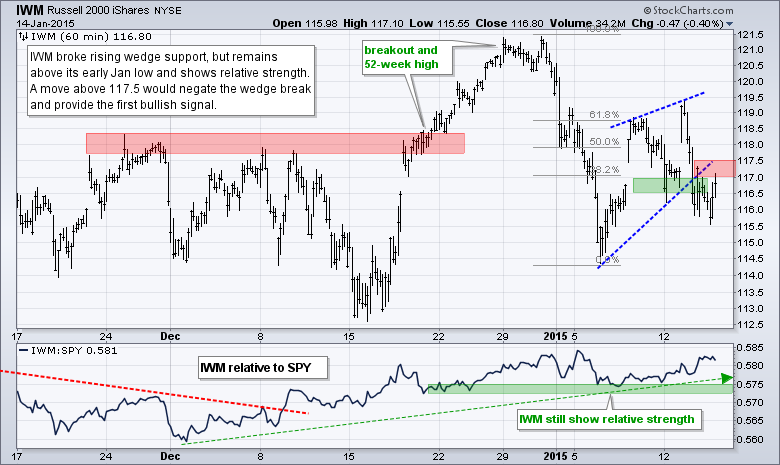
- QQQ, SPY and IWM remain in short-term downtrends and broken support zones turn first resistance.
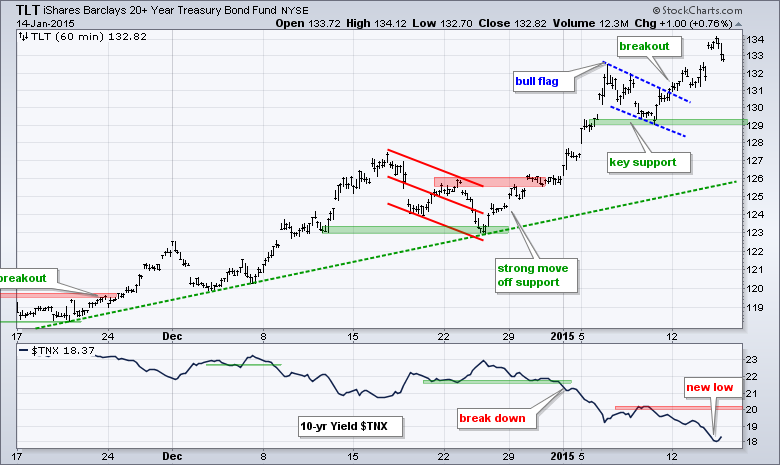
- TLT broke flag resistance last week and hit another new high on Wednesday.
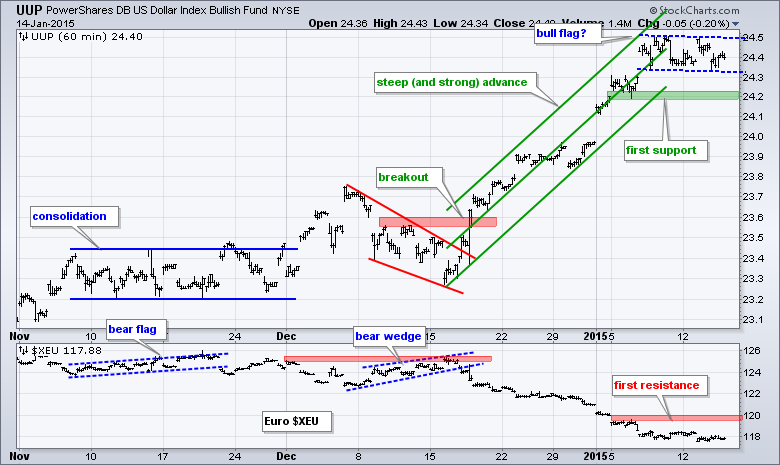
- UUP stalled over the past week, but remains in a strong uptrend overall.
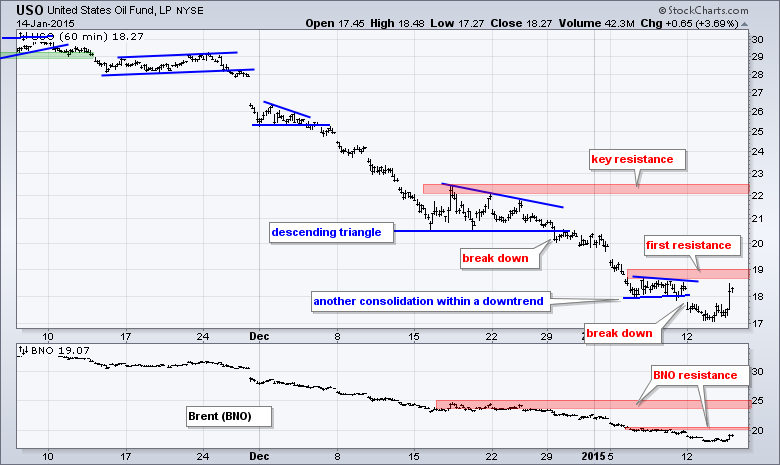
- USO got an oversold bounce, but remains in a strong downtrend.
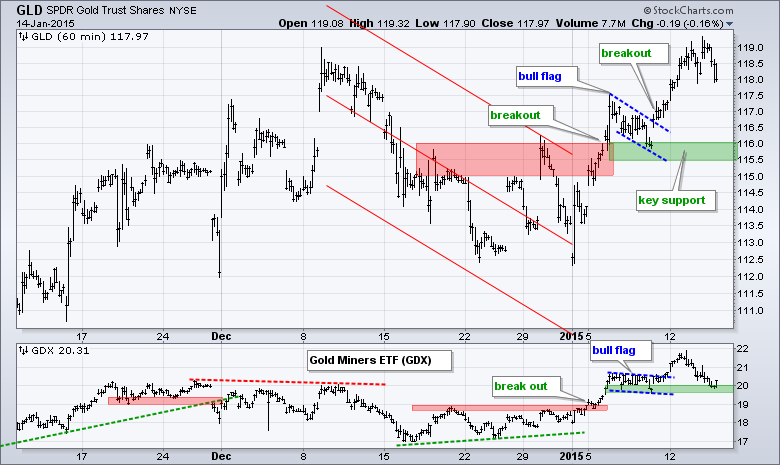
- GLD broke flag resistance last week and key support is set in the 115.5-116 area.
The E-mini dipped to 1981 during the session, but caught a late bid and closed at 2010 to form a hammer on the day. The decline has four days and the E-mini is down around 2% on a closing basis. As the numbers show (-2% in 4 days), this decline is not that dramatic. Further more, this hammer formed at a potential support zone and the long-term trend is up.
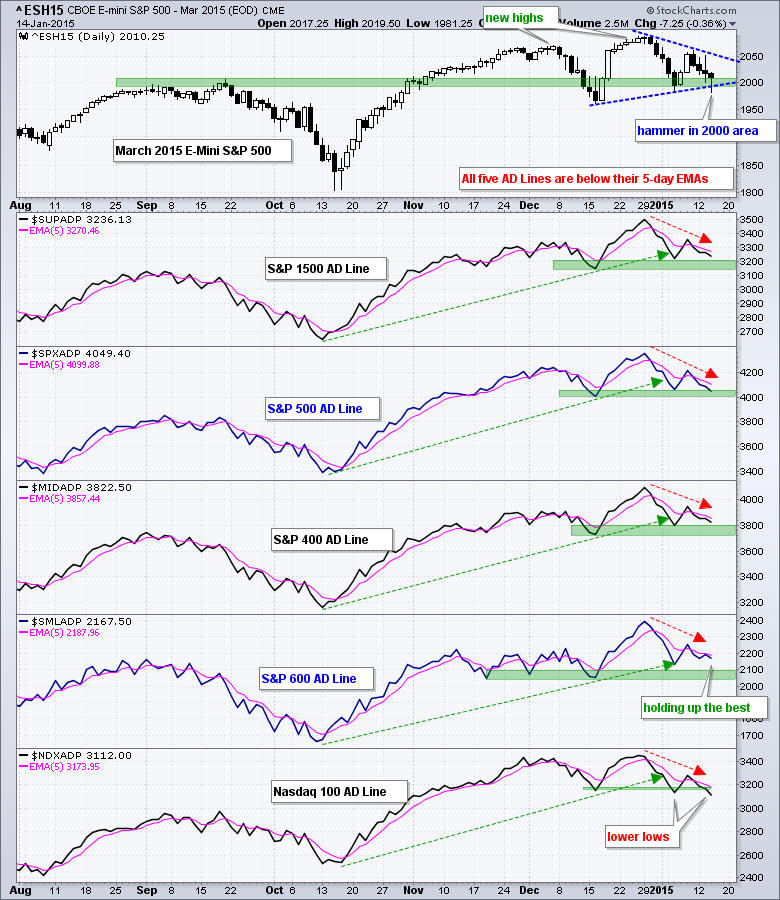
All five AD Lines are in short-term downtrends. The Nasdaq 100 AD Line moved below its prior lows and is the weakest of the five. The S&P 500 AD Line moved below its early January low, but remains above its mid December low and is the second weakest. The S&P Small-Cap 600 and S&P MidCap 400 AD Lines are holding up the best, but these two remain below their 5-day EMAs and have yet to turn up.
All five risk indicators are negative, but there is one small change afoot (possibly). The RSP:SPY ratio, which measures the performance of the equal-weight S&P 500 to the cap-weight S&P 500, formed a higher low over the last two days. The trend this year is still down, but the higher low suggests that small and mid caps within the S&P 500, are holding up better this week.
The bulk of the short-term evidence is bearish for stocks. The AD Lines are in downtrends this year, the major index ETFs broke support levels this week and the risk indicators are net negative. The finance sector is also starting to weigh because plunging Treasury yields are hurting banks. Even though the S&P 500 is near a support zone in the 2000 area, it is not quite yet oversold because the four day decline has been rather tame.
**************************************************************
**************************************************************
**************************************************************
**************************************************************
**************************************************************
**************************************************************
***************************************************************
Key Reports and Events (all times Eastern):
Thu - Jan 15 - 08:30 - Initial Jobless Claims
Thu - Jan 15 - 08:30 - Producer Price Index (PPI)
Thu - Jan 15 - 08:30 - Empire State Manufacturing
Thu - Jan 15 - 10:00 - Philadelphia Fed
Thu - Jan 15 - 10:30 - Natural Gas Inventories
Fri - Jan 16 - 08:30 - Consumer Price Index (CPI)
Fri - Jan 16 - 09:15 - Industrial Production
Fri - Jan 16 - 09:55 - Michigan Sentiment
This commentary is designed to stimulate thinking. This analysis is not a recommendation to buy, sell, hold or sell short any security (stock ETF or otherwise). We all need to think for ourselves when it comes to trading our own accounts. First, it is the only way to really learn. Second, we are the only ones responsible for our decisions. Think of these charts as food for further analysis. Before making a trade, it is important to have a plan. Plan the trade and trade the plan. Among other things, this includes setting a trigger level, a target area and a stop-loss level. It is also important to plan for three possible price movements: advance, decline or sideways. Have a plan for all three scenarios BEFORE making the trade. Consider possible holding times. And finally, look at overall market conditions and sector/industry performance.


