Stocks finally got an oversold bounce and even closed strong. Most of the bounce occurred with a morning pop, but SPY, IWM and QQQ managed to add to these early gains. In particular, IWM got a late surge and closed near the high of the day. SPY and QQQ closed below their noon highs. All sectors were up with the healthcare, consumer staples and consumer discretionary sectors leading the way. Biotechs stole the show yet again as the Biotech SPDR surged 4%. We also saw good strength in the Home Construction iShares (+3.27%) and the Retail SPDR (+2.62%). Note that ITB has a cup-with-handle pattern working since late November and a breakout would target a move to new highs. Strength retail bodes well for the consumer discretionary sector and the economy. Wednesday's move is considered an oversold bounce and the major index ETFs remain in short-term downtrends that are defined by the Raff Regression Channels. Follow through is needed to break channel resistance and fully reverse these short-term downtrends.
**This chart analysis is for educational purposes only, and should not
be construed as a recommendation to buy, sell or sell-short said securities**
Short-term Overview (Thursday, 8-January-2015):
- The AD Lines Bounced as four held above their mid December lows.
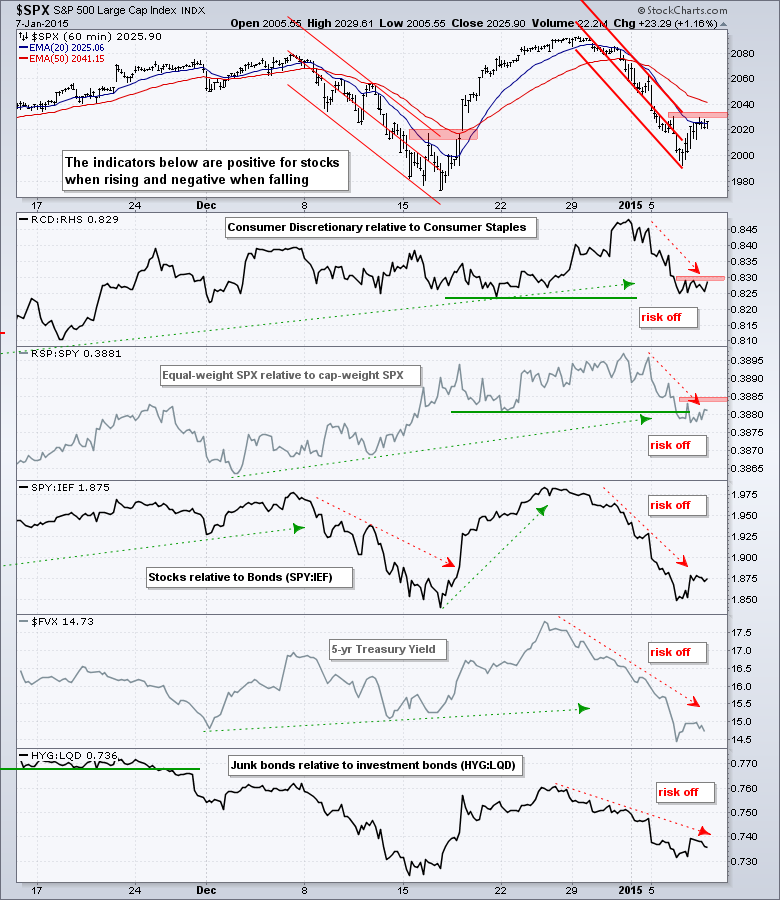
- The risk indicators bounced, but remain negative for January.
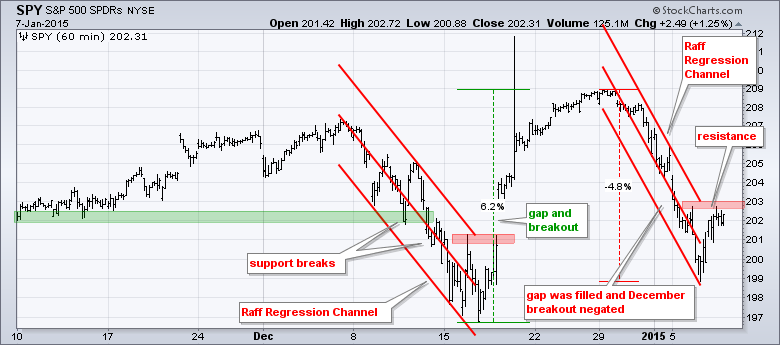
- SPY remains in a short-term downtrend with resistance at 203.
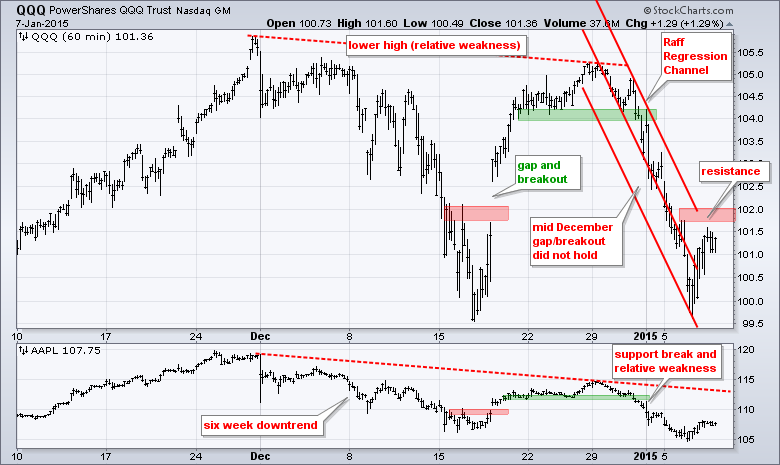
- QQQ shows relative weakness and is in a short-term downtrend with resistance at 102.
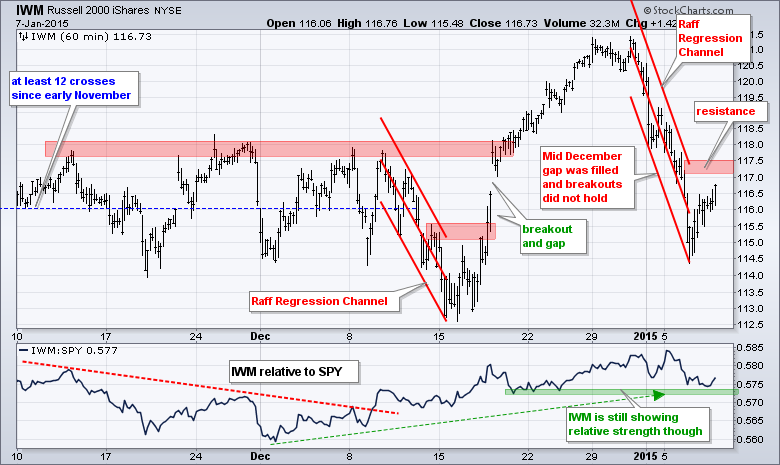
- IWM shows relative strength, but is in a short-term downtrend with resistance at 117.5.
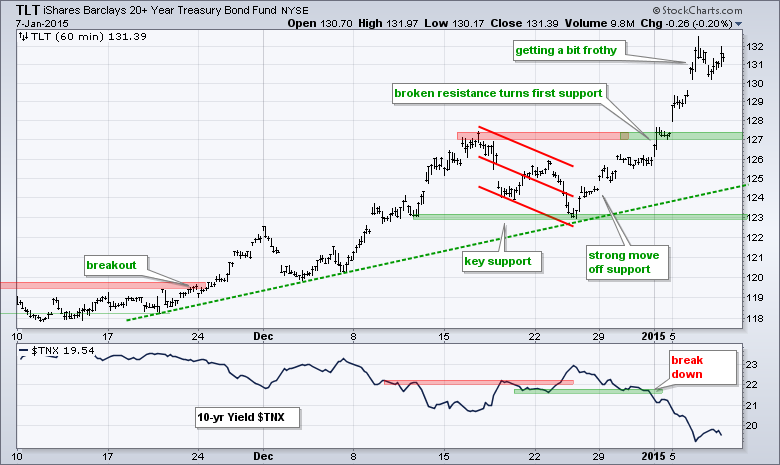
- TLT remains in an uptrend, but this move is getting frothy as the employment report looms.
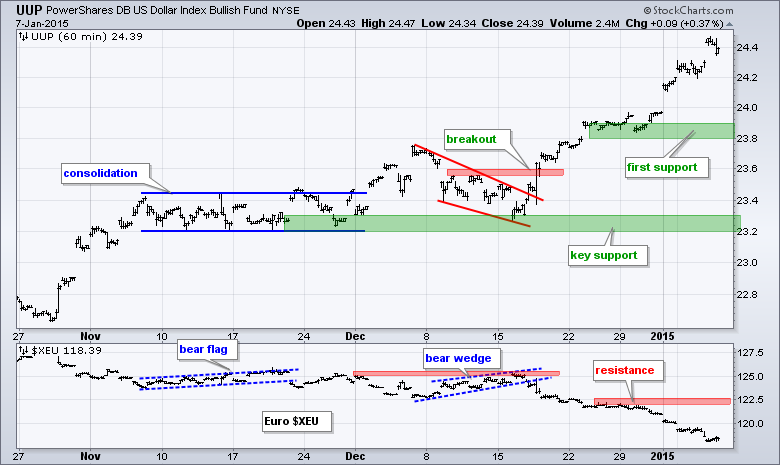
- UUP remains in a strong uptrend, but is also getting overextended and ripe for a rest.
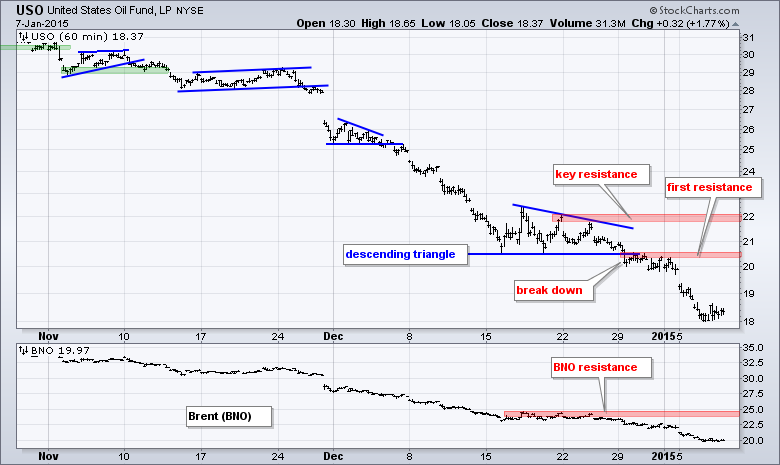
- USO broke descending triangle support in late December and continued its downtrend.
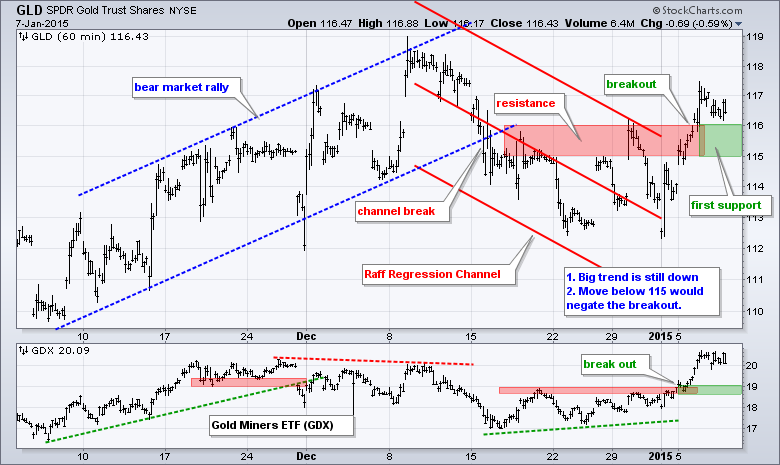
- GLD reversed its downtrend with a breakout on 6-Jan and needs to hold 115 to keep this breakout alive.
The E-mini and the S&P 500 got bounces off the 2000 area. This area acted as resistance in September and then support in mid December. Yes, there was an overshoot in mid December, but overshoots are quite common these days because volatility has picked up since early December. The E-mini and S&P 500 also overshot their 62% retracements on Monday-Tuesday before getting a bounce on Wednesday. Despite this bounce, the E-mini is still in a downtrend over the last seven days and a follow through break above 2030 is needed to break the Raff Regression Channel.
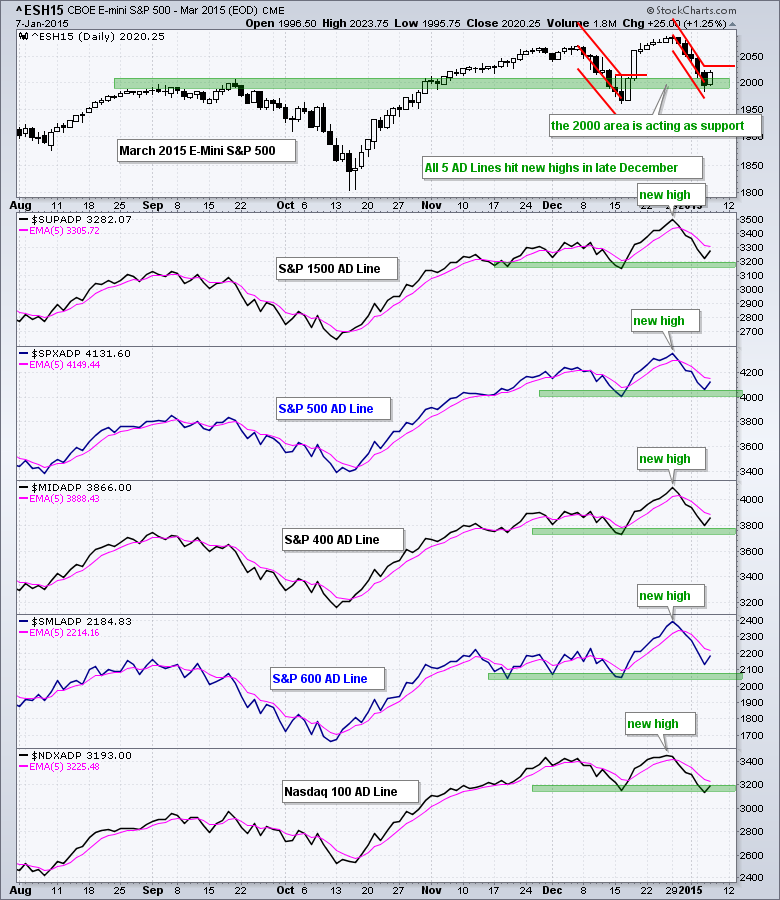
All five AD Lines bounced on Wednesday, but remain below their 5-day EMAs and some follow through is needed for a moving average cross. Of note, the Nasdaq 100 AD Line was the only one to break below the mid December low. The other four held above their mid December lows and remain in clear uptrends overall. The S&P Small-Cap 600 AD Line maintained the most distance between its mid December low and Tuesday's low.
The risk indicators got bounces as well on Tuesday, but remain negative this month. The red resistance zones mark the key levels for the two stock-related risk indicators. A breakout would signal relative strength in the consumer discretionary sector and the Equal-Weight S&P 500 ETF (RSP).
The next segment shows the key charts with detailed annotations describing the developments.
**************************************************************
**************************************************************
**************************************************************
**************************************************************
**************************************************************
**************************************************************
***************************************************************
Key Reports and Events (all times Eastern):
Thu - Jan 08 - 07:30 - Challenger Job
Thu - Jan 08 - 08:30 - Initial Jobless Claims
Thu - Jan 08 - 10:30 - Natural Gas Inventories
Thu - Jan 08 - 14:00 - Consumer Credit
Fri - Jan 09 - 08:30 - Nonfarm Payrolls
Fri - Jan 09 - 10:00 - Wholesale Inventories
This commentary is designed to stimulate thinking. This analysis is not a recommendation to buy, sell, hold or sell short any security (stock ETF or otherwise). We all need to think for ourselves when it comes to trading our own accounts. First, it is the only way to really learn. Second, we are the only ones responsible for our decisions. Think of these charts as food for further analysis. Before making a trade, it is important to have a plan. Plan the trade and trade the plan. Among other things, this includes setting a trigger level, a target area and a stop-loss level. It is also important to plan for three possible price movements: advance, decline or sideways. Have a plan for all three scenarios BEFORE making the trade. Consider possible holding times. And finally, look at overall market conditions and sector/industry performance.


