The technology sector came to life with a modest gain on Tuesday, but the consumer discretionary and finance sectors countered with declines. Relative weakness in finance is getting to be a problem for the overall market and may not clear up as long as Treasury yields fall. The consumer discretionary sector was hit with weakness in the Home Construction iShares and Retail SPDR, which represent two key economic groups. Overall, the sector rotations reflect a defensive and risk-averse stock market in 2015 because the utilities, consumer staples and healthcare sectors are the leaders right now. This means choppy trading with a downward drift could continue. Note that volatility could also increase this week because we are in the middle of earnings season, the European Central Bank (ECB) meets on Thursday and the Greek elections are this weekend.
**This chart analysis is for educational purposes only, and should not
be construed as a recommendation to buy, sell or sell-short said securities**
Short-term Overview (Wednesday, 21-January-2015):
- The AD Lines are in short-term downtrends (since late December).
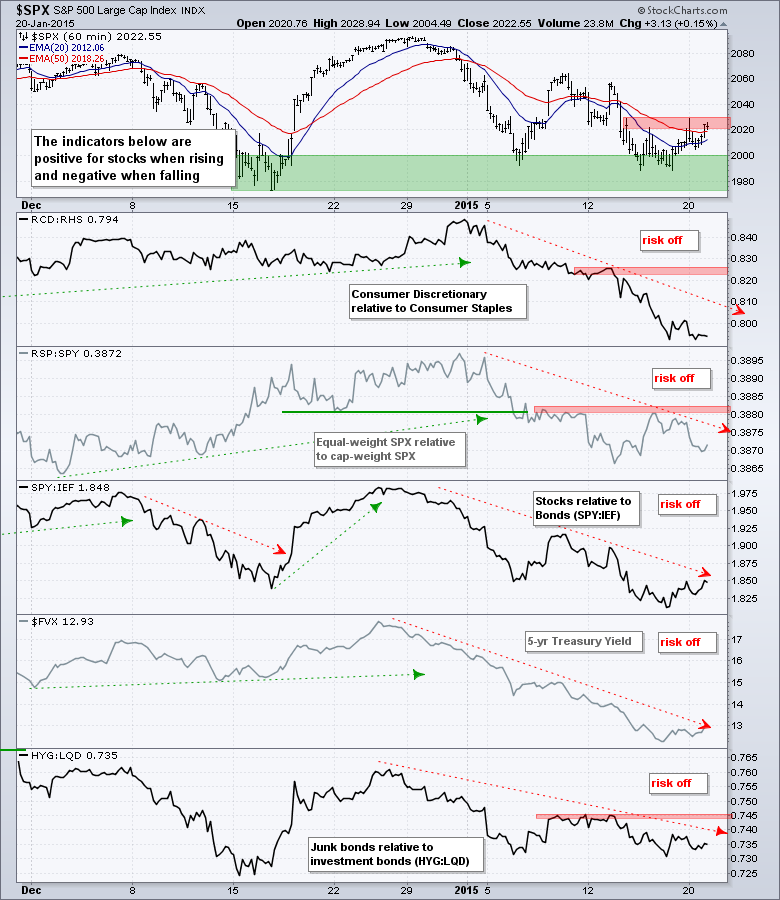
- The risk indicators remain negative overall.
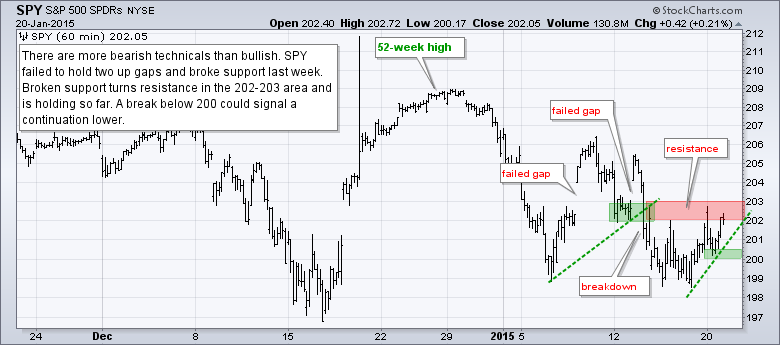
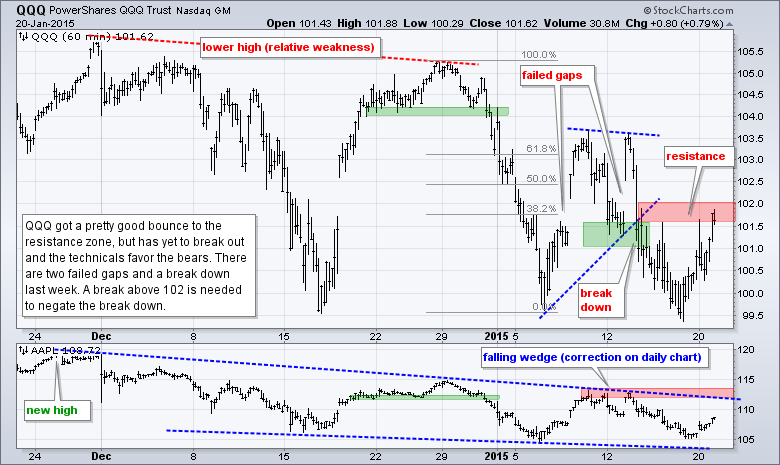
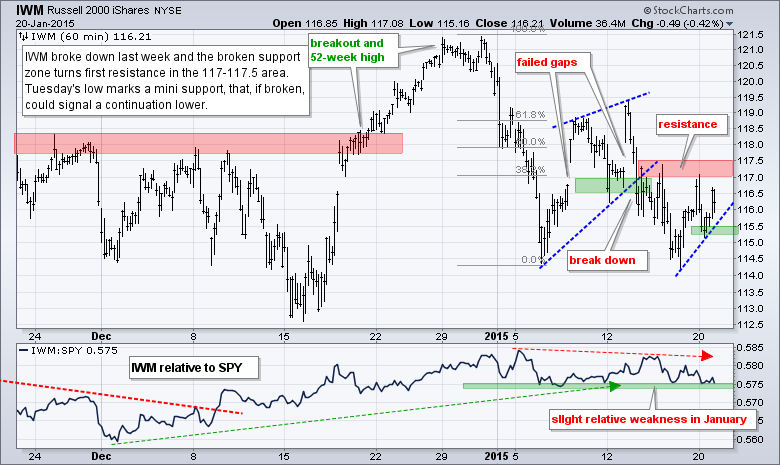
- QQQ, SPY and IWM bounced on Friday, but have yet to negate their support breaks from last week.
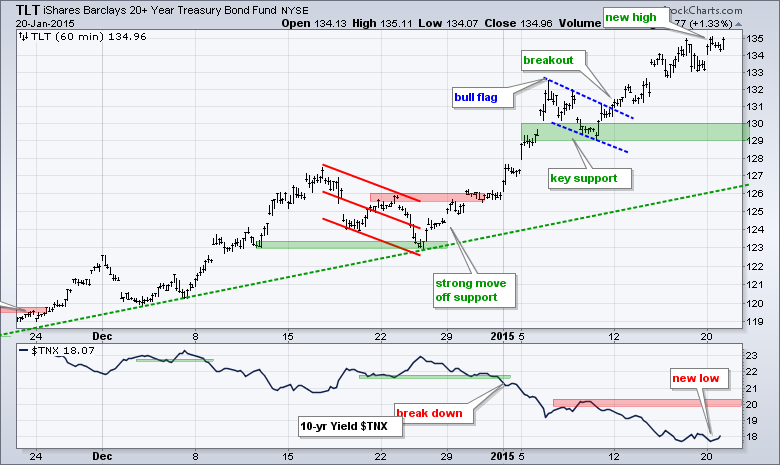
- TLT broke flag resistance on 12-Jan and hit another new high on Tuesday.
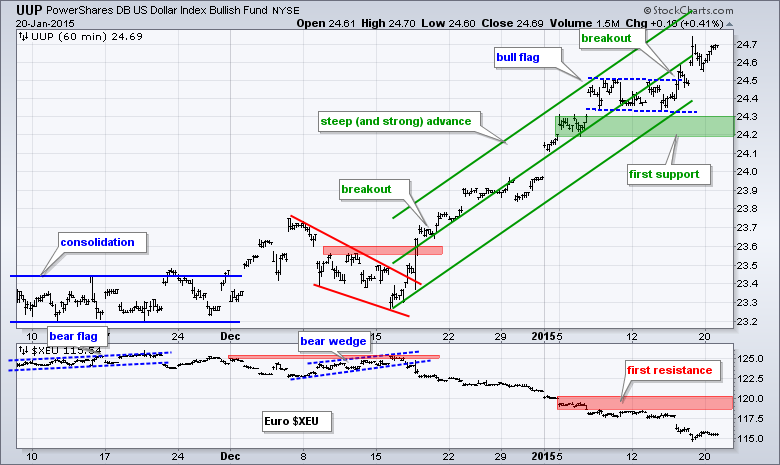
- UUP broke flag resistance last week and this breakout is holding.
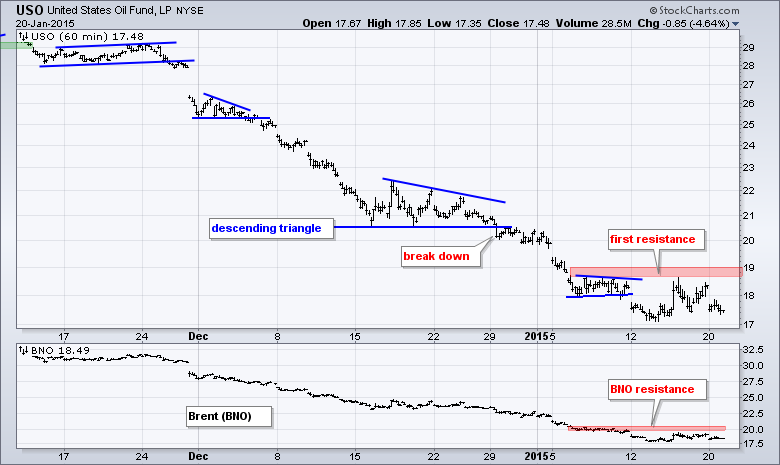
- USO got an oversold bounce last week, but turned down again on Tuesday to affirm first resistance.
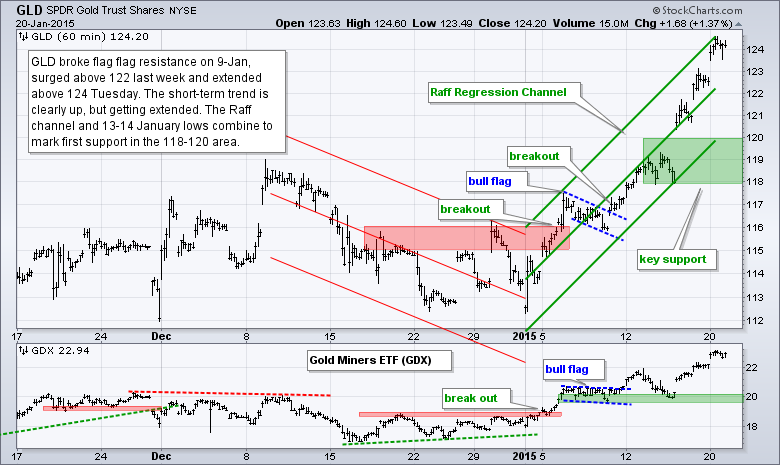
- GLD extended its short-term uptrend and I am marking support in the 118-120 area.
The E-mini bounced on Friday and stalled on Tuesday with indecisive price action. Notice that the open and the close were almost equal (2013-2015). The high was at 2026.5 and the low at 1997.5. Taken together, an indecisive candlestick formed just below the late December trend line. We have yet to see follow through to Friday's advance and a move above 2040 is needed to reverse the short-term downtrend.
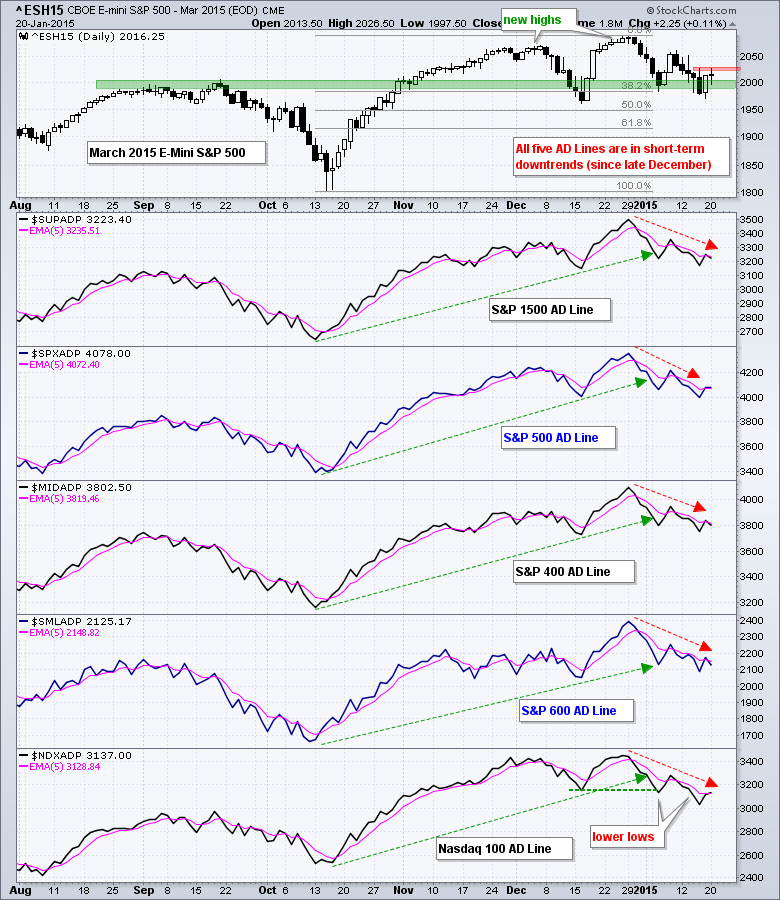
Breadth was mixed on Tuesday and the AD Lines remain in short-term downtrends since late December. S&P 500 AD Percent was flat, Nasdaq 100 AD Percent was positive (+18%), S&P MidCap AD Percent was negative (-33.75%) and S&P SmallCap AD Percent was negative (-45.50%). Taken as a whole, S&P 1500 AD Percent was clearly negative on Tuesday (-27.5%).
All five risk indicators remain negative (risk off). The Equal-Weight S&P 500 ETF (RSP) outperformed the S&P 500 SPDR (SPY) for a few days last week, but relative weakness returned on Tuesday as small and mid caps fell. Relative weakness in the Equal-Weight S&P 500 ETF means relative strength in the S&P 500 SPDR, which means relative strength in large-caps. This points to risk-aversion or les risk appetite because small and mid cap stocks have higher betas than large-cap stocks.
The bulk of the short-term evidence remains bearish for stocks. All five AD Lines are in short-term downtrends. All five risk indicators are negative and the major index ETFs broke down last week. QQQ got a nice bounce on Tuesday, but IWM lagged with a small loss and SPY was flat. Last week's support breaks are still holding and have yet to be negated.
**************************************************************
**************************************************************
**************************************************************
**************************************************************
**************************************************************
**************************************************************
***************************************************************
Key Reports and Events (all times Eastern):
Tue - Jan 20 - 10:00 - NAHB Housing Market Index
Wed - Jan 21 - 07:00 - MBA Mortgage Index
Wed - Jan 21 - 08:30 - Housing Starts/Building Permits
Thu - Jan 22 - 08:00 - European Central Bank (ECB) Meeting
Thu - Jan 22 - 08:30 - Initial Jobless Claims
Thu - Jan 22 - 09:00 - FHFA Housing Price Index
Thu - Jan 22 - 10:30 - Natural Gas Inventories
Thu - Jan 22 - 11:00 - Oil Inventories
Fri - Jan 23 - 10:00 - Existing Home Sales
Fri - Jan 23 - 10:00 - Leading Economic Indicators
Sun - Jan 25 - 09:00 - Greek Election
This commentary is designed to stimulate thinking. This analysis is not a recommendation to buy, sell, hold or sell short any security (stock ETF or otherwise). We all need to think for ourselves when it comes to trading our own accounts. First, it is the only way to really learn. Second, we are the only ones responsible for our decisions. Think of these charts as food for further analysis. Before making a trade, it is important to have a plan. Plan the trade and trade the plan. Among other things, this includes setting a trigger level, a target area and a stop-loss level. It is also important to plan for three possible price movements: advance, decline or sideways. Have a plan for all three scenarios BEFORE making the trade. Consider possible holding times. And finally, look at overall market conditions and sector/industry performance.


