Stocks surged in early trading, worked their way lower in mid morning and then plunged after lunch. With a small rebound in the final hour, the net losses were reduced and the major index ETFs closed fractionally lower. The Russell 2000 held up the best and closed fractionally higher. Energy, materials, home construction, miners and steel led the way down. With the exception of home construction, these groups have been weak for some time. The Home Construction iShares (ITB) was whacked after KB Home (KBH) said gross margins would be lower due to sales incentives and higher costs.
**This chart analysis is for educational purposes only, and should not
be construed as a recommendation to buy, sell or sell-short said securities**
Short-term Overview (Wednesday, 14-January-2015):
- The AD Lines are in three week downtrends and below their 5-day EMAs.
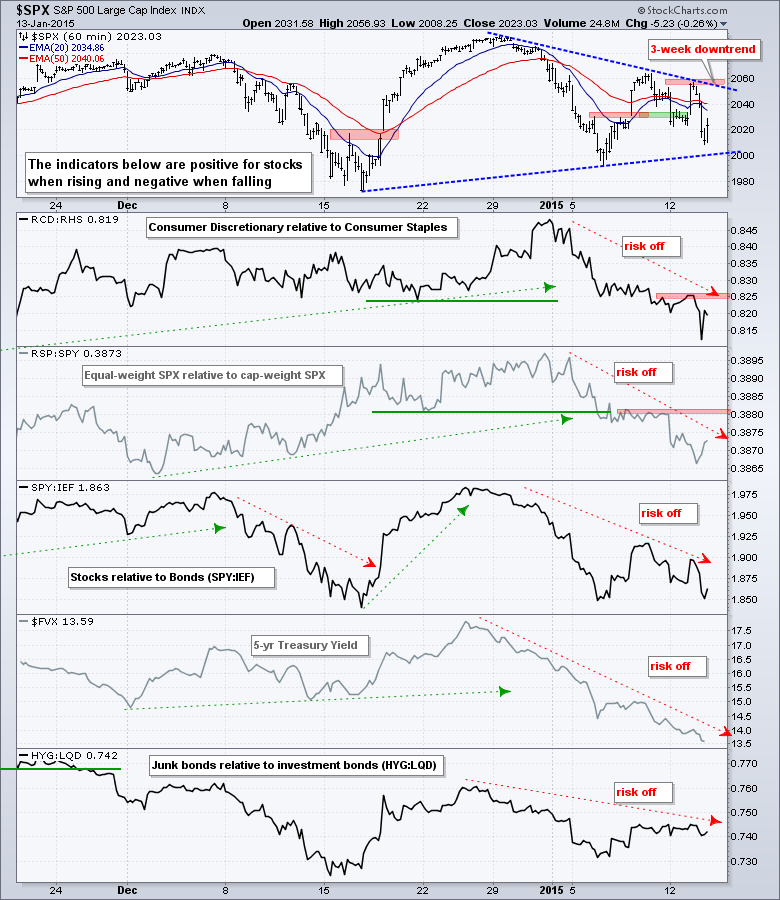
- The risk indicators remain negative overall.
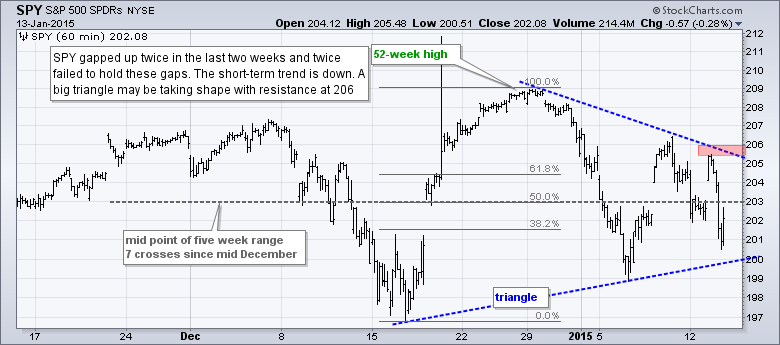
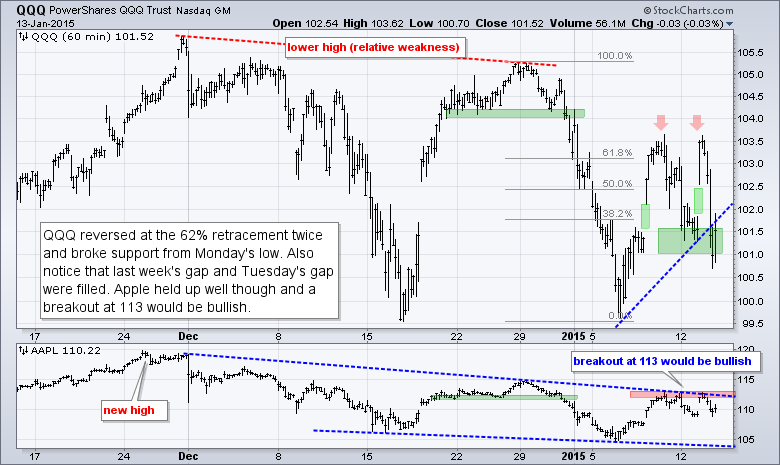
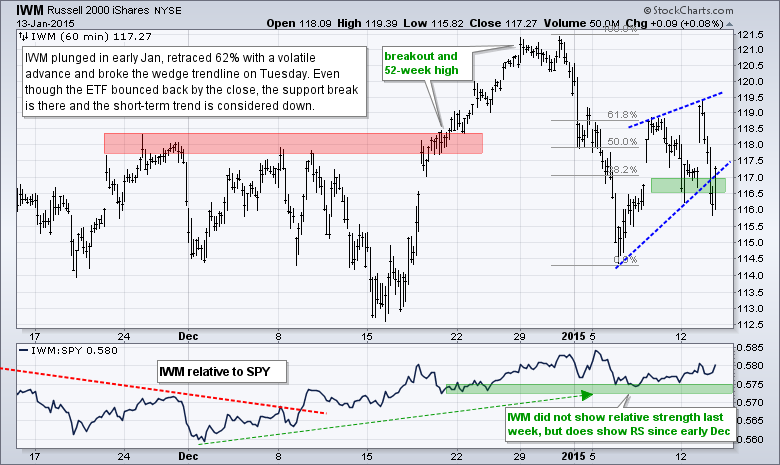
- QQQ, SPY and IWM failed to hold their morning gaps and broke short-term support on 13-Dec.
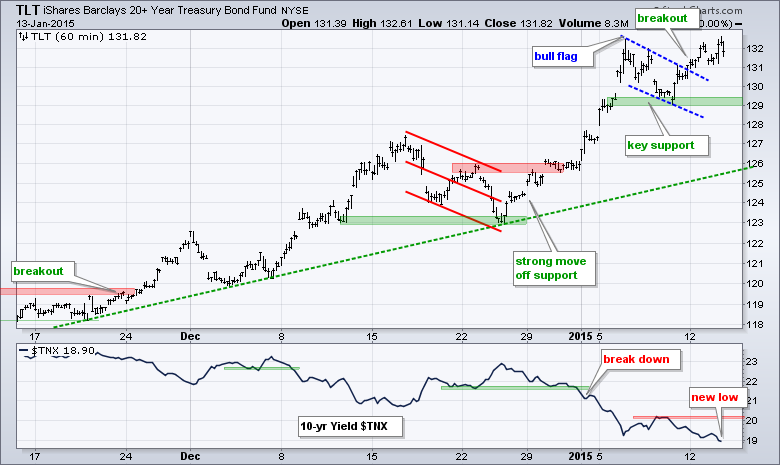
- TLT broke flag resistance last week and hit another new high on Tuesday.
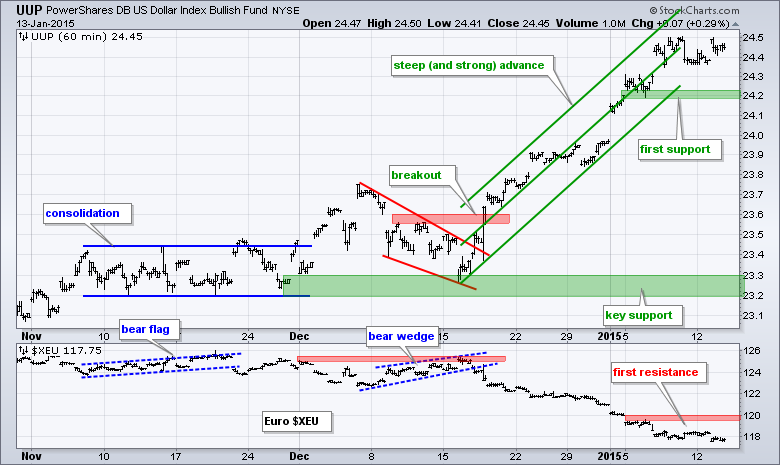
- UUP stalled over the past week, but remains in a strong uptrend overall.
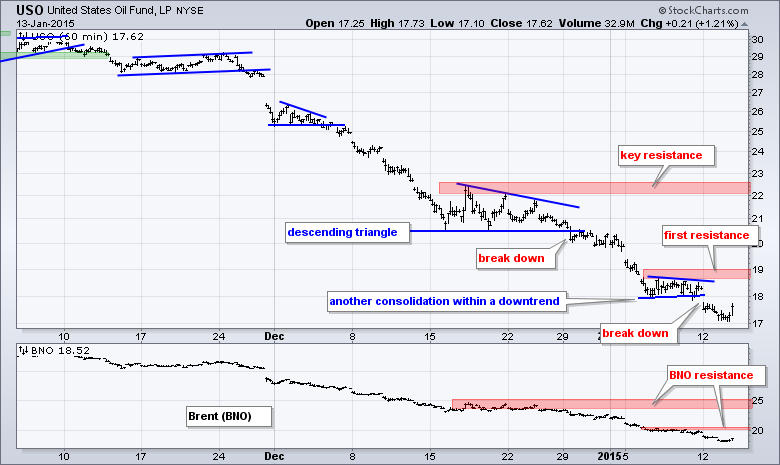
- USO got an oversold bounce, but remains in a strong downtrend.
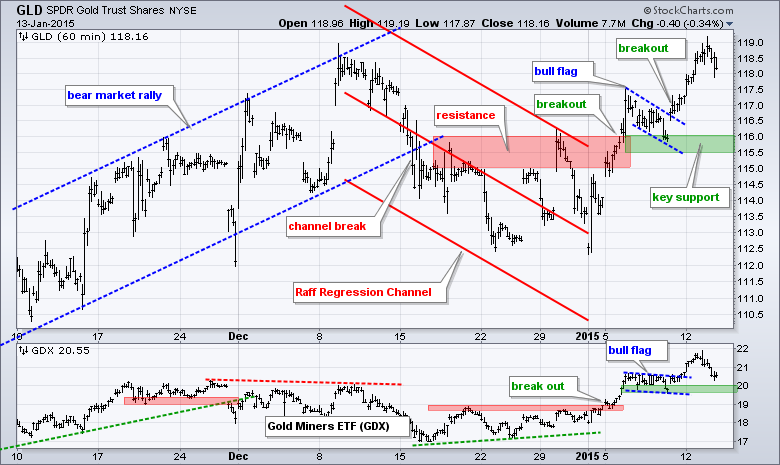
- GLD broke flag resistance last week and key support is set in the 115.5-116 area.
The E-mini went on a wild roller coaster ride with a surge above 2050, a plunge to 2000 and a close at 2017. A big indecisive candlestick formed as a result. Technically, last week's breakout failed to hold because the E-mini closed below 2020. There is still a bigger support zone in the 2000 area though.
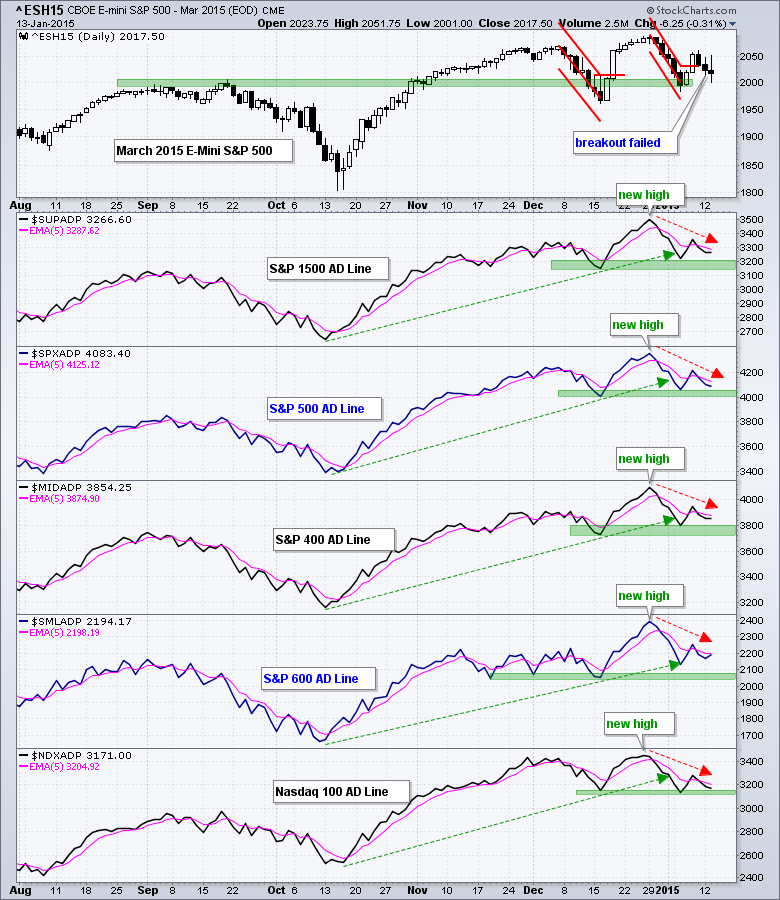
Four of the five AD Lines moved lower on Tuesday. The S&P Small-Cap 600 AD Line bucked the decline and edged higher. Again, we are seeing relative strength in small-cap breadth and this is the group that may lead any rebound in the stock market. The S&P MidCap 400 AD Line was down just a fraction and the least weak of the other four. Overall, the five AD Lines are in three week downtrends and below their 5-day EMAs.
All five risk indicators are negative. The consumer discretionary sector has been underperforming the consumer staples sector the last three weeks, and the equal-weight S&P 500 has been underperforming the cap-weight S&P 500. Treasuries continue to move higher as the 5-year Treasury Yield ($FVX) sank to another new low for the move.
The bulk of the short-term evidence is bearish for stocks. The AD Lines are in three week downtrends, the risk indicators are net negative and the major index ETFs failed to hold their morning gaps. SPY, QQQ and IWM broke short-term support levels. Overall, stocks have been extremely volatile since early December. Note that there were three 5+ percent swings in SPY from 5-December to 6-January. The ETF then surged 3.5% Wednesday-Thursday last week and gave most of it back with a volatile decline the last three days. Increased volatility means increased risk, especially for the short-term. Volatility also makes short-term analysis and trading challenging - to say the least.
**************************************************************
**************************************************************
**************************************************************
**************************************************************
**************************************************************
**************************************************************
***************************************************************
Key Reports and Events (all times Eastern):
Tue - Jan 13 - 10:00 - JOLTS - Job Openings
Tue - Jan 13 - 14:00 - Treasury Budget
Wed - Jan 14 - 07:00 - MBA Mortgage Index
Wed - Jan 14 - 08:30 - Retail Sales
Wed - Jan 14 - 10:30 - Oil Inventories
Wed - Jan 14 - 14:00 - Fed's Beige Book
Thu - Jan 15 - 08:30 - Initial Jobless Claims
Thu - Jan 15 - 08:30 - Producer Price Index (PPI)
Thu - Jan 15 - 08:30 - Empire State Manufacturing
Thu - Jan 15 - 10:00 - Philadelphia Fed
Thu - Jan 15 - 10:30 - Natural Gas Inventories
Fri - Jan 16 - 08:30 - Consumer Price Index (CPI)
Fri - Jan 16 - 09:15 - Industrial Production
Fri - Jan 16 - 09:55 - Michigan Sentiment
This commentary is designed to stimulate thinking. This analysis is not a recommendation to buy, sell, hold or sell short any security (stock ETF or otherwise). We all need to think for ourselves when it comes to trading our own accounts. First, it is the only way to really learn. Second, we are the only ones responsible for our decisions. Think of these charts as food for further analysis. Before making a trade, it is important to have a plan. Plan the trade and trade the plan. Among other things, this includes setting a trigger level, a target area and a stop-loss level. It is also important to plan for three possible price movements: advance, decline or sideways. Have a plan for all three scenarios BEFORE making the trade. Consider possible holding times. And finally, look at overall market conditions and sector/industry performance.


