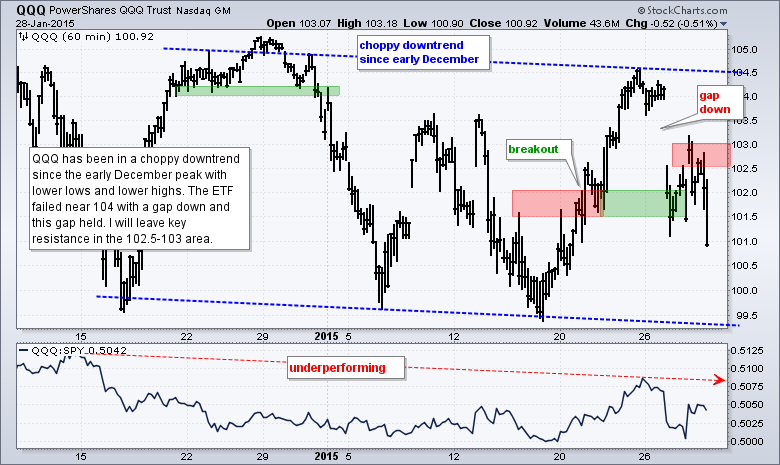
Stocks took it on the chin again on Wednesday with the major index ETFs losing over 1%. Well, QQQ managed a 0.5% loss because Apple and Facebook gained. Nevertheless, 89 out of the 100 stocks in QQQ declined and selling pressure was pretty lopsided. Energy-related stocks were hammered as oil resumed its downtrend, which was signaled with Friday's triangle break. All in all, selling pressure was across the board and in all indsutry groups. Looking for blame? Earnings season has been below par and the market is reacting negatively to this news. At the risk of sounding obvious, a negative reaction to bad news is bearish. A strong market would shrug off this news and look forward. It appears that Mr Market sees some softness ahead and is pricing this into stocks.
**This chart analysis is for educational purposes only, and should not
be construed as a recommendation to buy, sell or sell-short said securities**
Short-term Overview (Thursday, 29-January-2015):
- Four of the five AD Lines formed lower highs and all five broke their 5-day EMAs.
- Three of five risk indicators are negative.
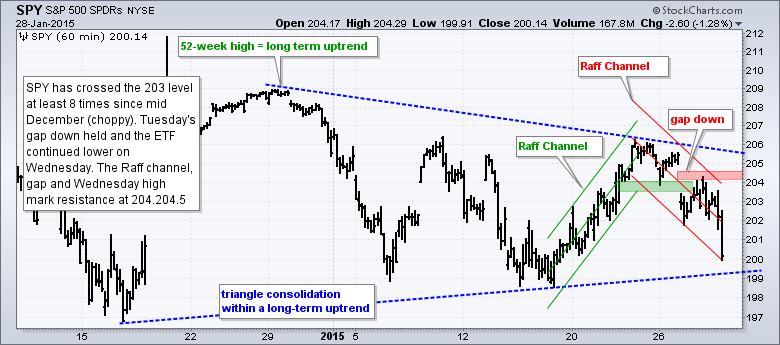
- QQQ and SPY failed to hold their breakouts, gapped down on 28-Jan and are short-term bearish.
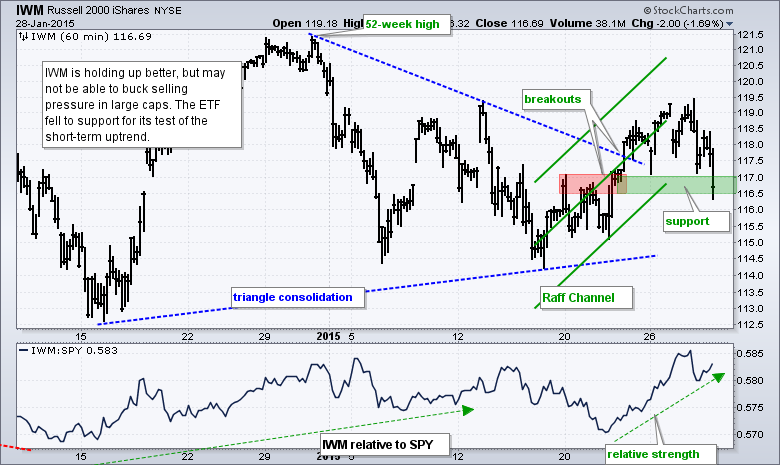
- IWM broke out on 22-Jan and is now testing this breakout zone.
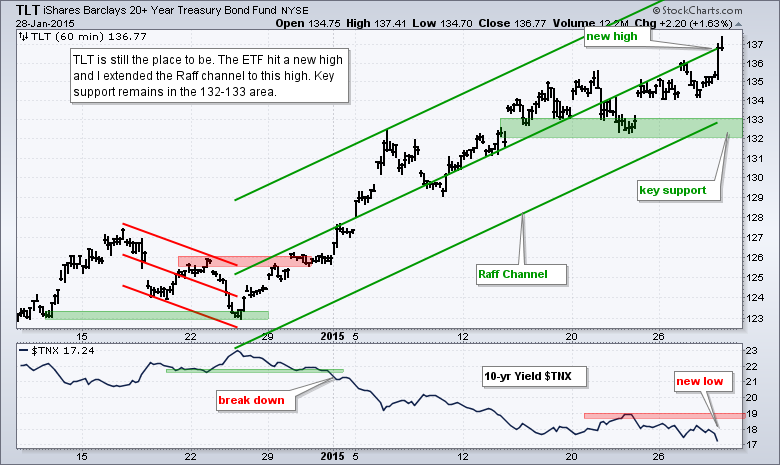
- TLT hit another new high and remains in a strong uptrend.
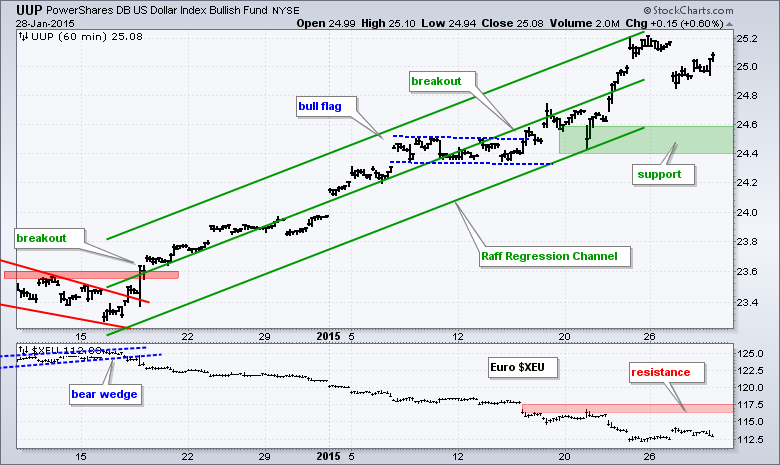
- UUP fell on Tuesday morning, but bounced back and remains in an uptrend.
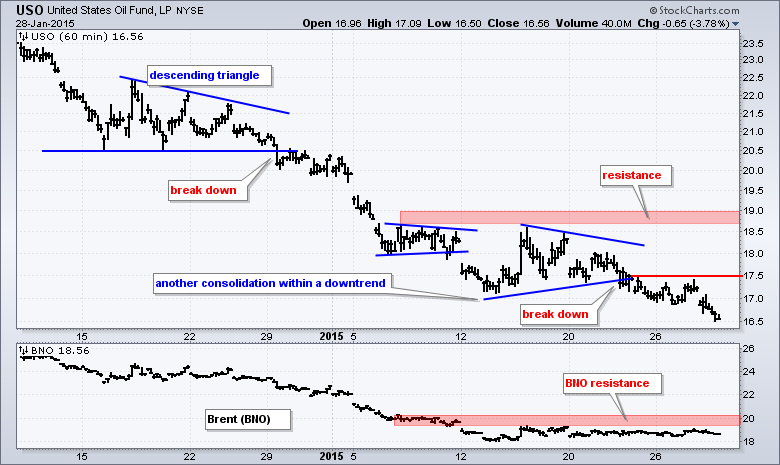
- USO formed a triangle consolidation within its downtrend and broke the lower trend line on Friday.
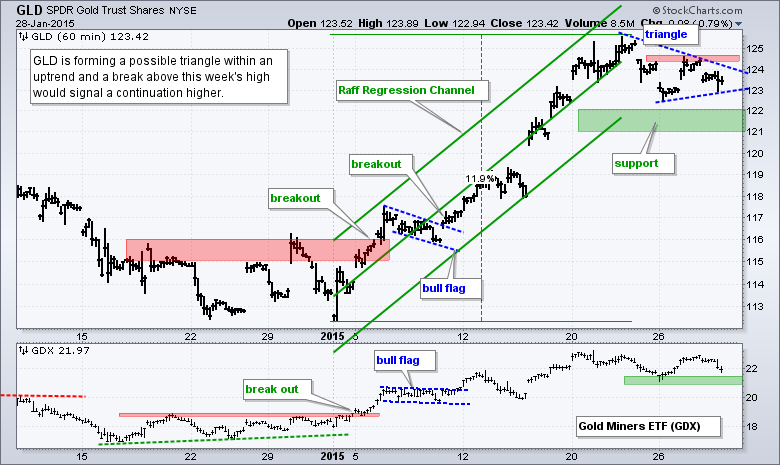
- GLD is forming a possible triangle within a short-term uptrend.
The E-mini broke out last week and gave it back this week. The long black candlestick and sharp decline below 2020 are short-term bearish.
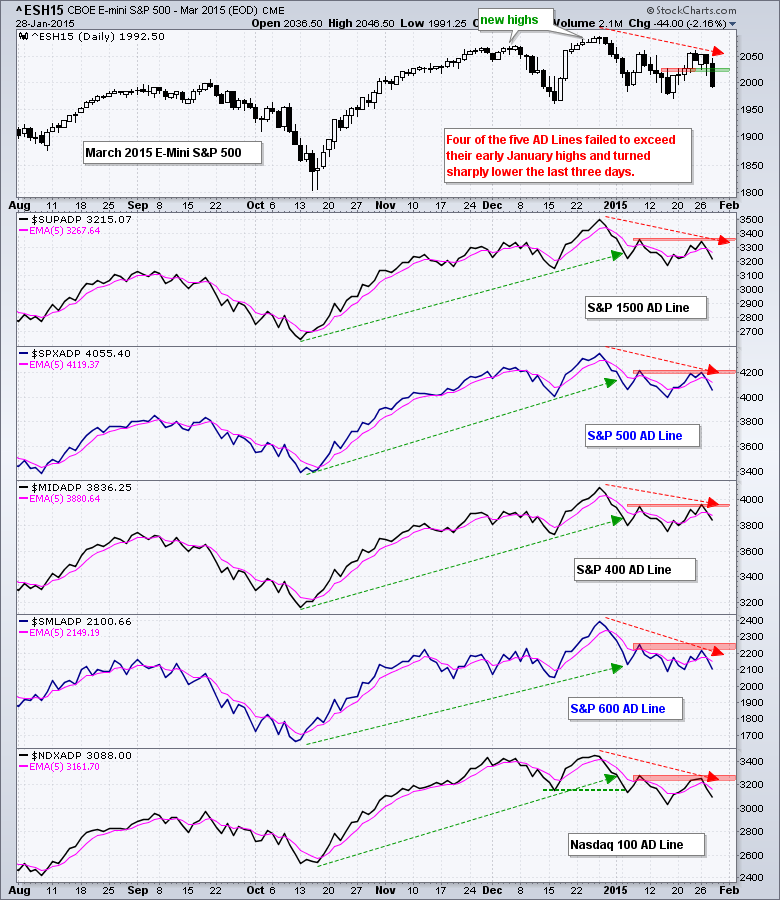
All five AD Lines fell sharply this week and moved below their 5-day EMAs. Also note that four of the five did not exceed their early January highs, thus forming lower highs. The S&P MidCap AD Line was the only one to exceed its early January high. With four of the five forming lower highs and all five below their 5-day EMAs, short-term breadth is bearish again.
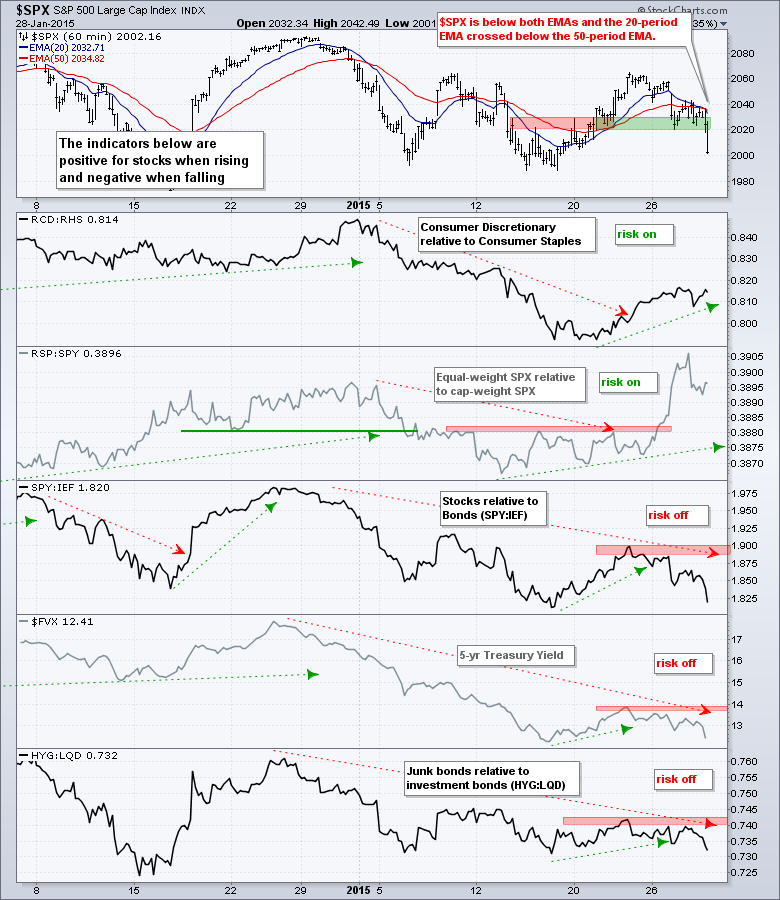
Three of the five risk indicators are negative. The two stock related indicators are positive, but this is mostly because the Equal-weight Consumer Staples ETF (RHS) fell much more than the Equal-Weight Consumer Discretionary ETF (RCD) and the S&P 500 SPDR (SPY) fell much more than the Equal-Weight S&P 500 ETF (RSP). The three bond-related indicators are risk-off as money continues to move into Treasury bonds and junk bonds continue to underperform investment grade bonds.
The short-term evidence is bearish. Four of the five AD Lines are clearly weak. Three of the five risk indicators are bearish. SPY and QQQ gapped down and stayed down. IWM is holding up, but cannot go it alone.
**************************************************************
**************************************************************
**************************************************************
**************************************************************
**************************************************************
**************************************************************
***************************************************************
Key Reports and Events (all times Eastern):
Thu - Jan 29 - 08:30 - Initial Jobless Claims
Thu - Jan 29 - 10:00 - Pending Home Sales
Thu - Jan 29 - 10:30 - Natural Gas Inventories
Fri - Jan 30 - 08:30 - GDP
Fri - Jan 30 - 09:45 - Chicago PMI
Fri - Jan 30 - 09:55 - Michigan Sentiment
This commentary is designed to stimulate thinking. This analysis is not a recommendation to buy, sell, hold or sell short any security (stock ETF or otherwise). We all need to think for ourselves when it comes to trading our own accounts. First, it is the only way to really learn. Second, we are the only ones responsible for our decisions. Think of these charts as food for further analysis. Before making a trade, it is important to have a plan. Plan the trade and trade the plan. Among other things, this includes setting a trigger level, a target area and a stop-loss level. It is also important to plan for three possible price movements: advance, decline or sideways. Have a plan for all three scenarios BEFORE making the trade. Consider possible holding times. And finally, look at overall market conditions and sector/industry performance.


