Stocks continued their volatile ways as SPY and QQQ fell sharply on the open, rebounded and then sold off in the final hour. Microsoft and Durable Goods got most of the blame. The strong Dollar is also affecting earnings in large-caps. Small-caps held up quite well as IWM fell just .50% on the day. The technology sector bore the brunt of selling pressure as XLK fell almost 3%. Selling pressure also extended to the Equal-weight Technology ETF (RYT) and SmallCap Technology ETF (PSCT). The volatility did not end after hours because stock futures are again all over the place. Stock futures surged as Yahoo, Apple and AT&T beat, but sold off after midnight as European news hit the tape. The Fed makes is policy statement today so we can expect volatility to continue.
**This chart analysis is for educational purposes only, and should not
be construed as a recommendation to buy, sell or sell-short said securities**
Short-term Overview (Wednesday, 28-January-2015):
- All five AD Lines are in short-term uptrends, but large-caps are stalling.
- The risk indicators are net negative.
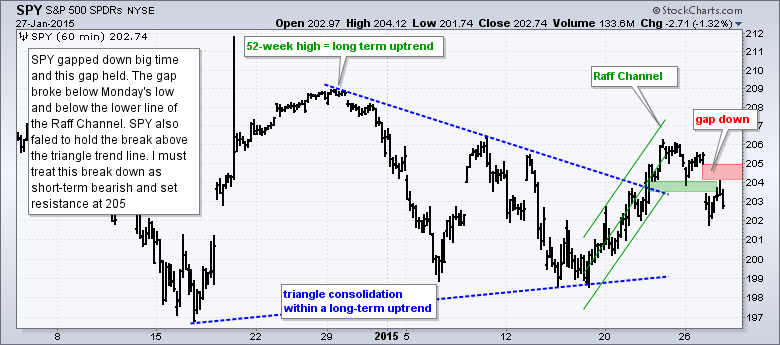
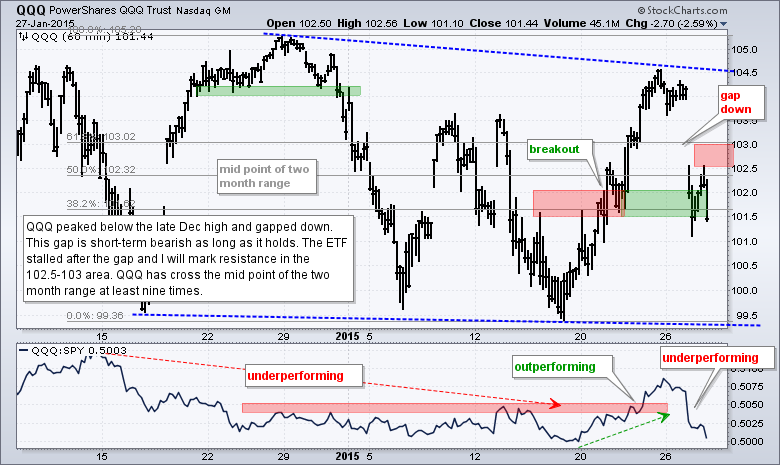
- QQQ and SPY failed to hold their breakouts, gapped down and are short-term bearish.
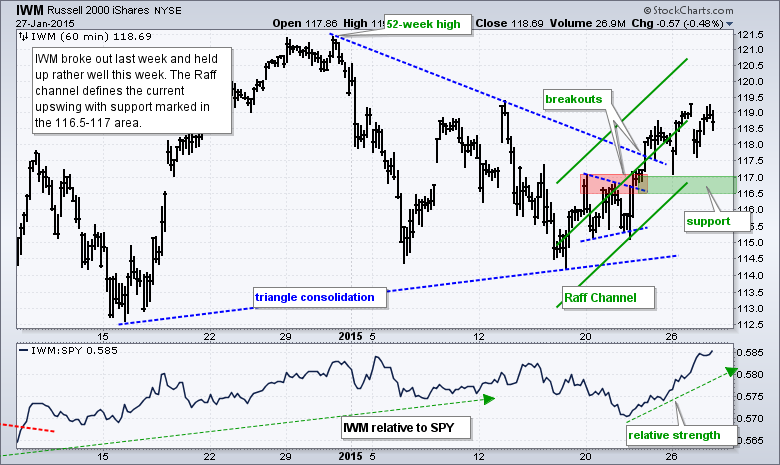
- IWM broke out on 22-Jan and shows relative strength the last few days.
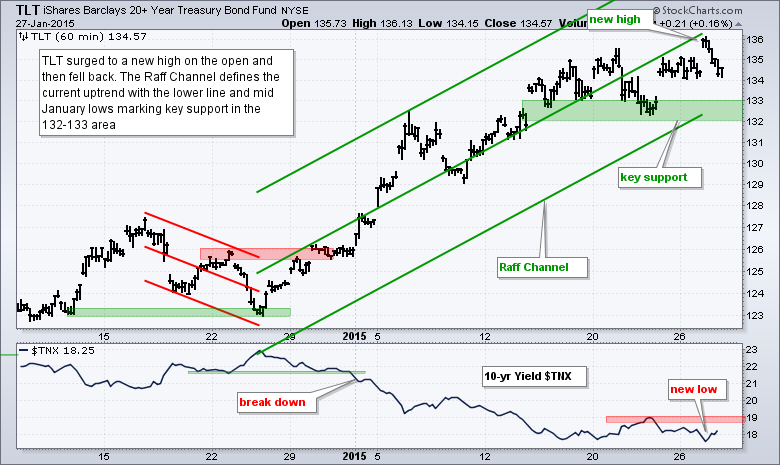
- TLT remains in an uptrend that is defined by a Raff Regression Channel.
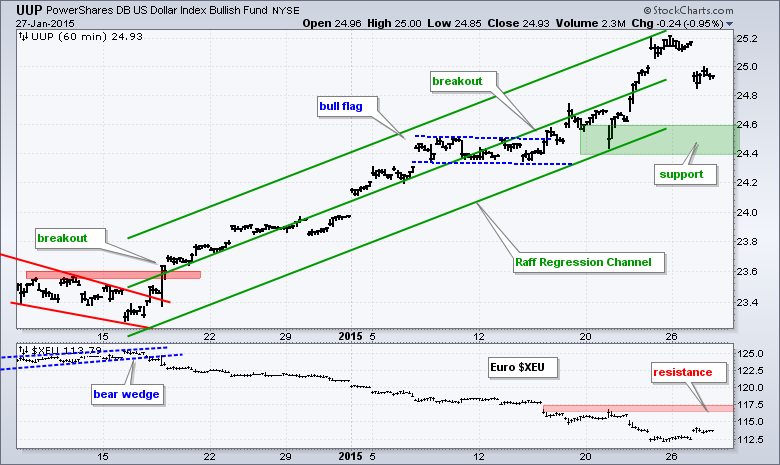
- UUP fell back as the Euro bounced, but remains in an uptrend overall.
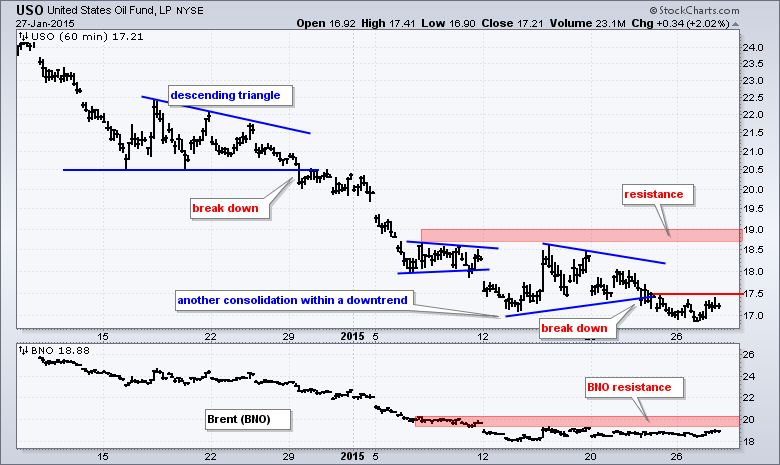
- USO formed a triangle consolidation within its downtrend and broke the lower trend line on Friday.
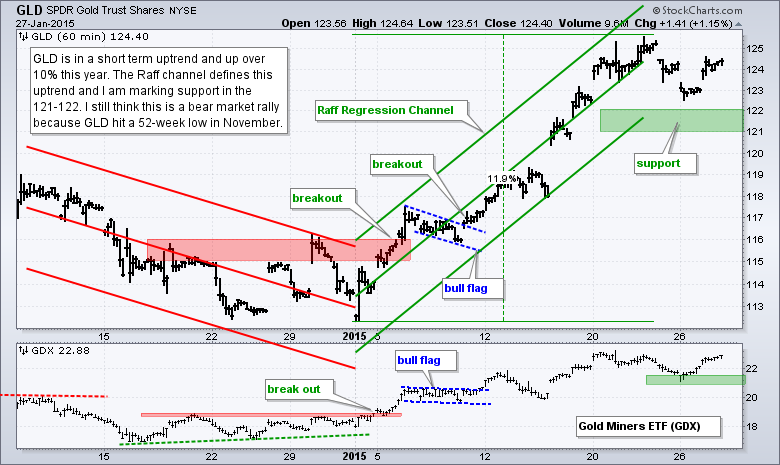
- GLD is in a short-term uptrend defined by a Raff Regression Channel.
The E-mini broke out with a surge last week and the broken resistance zone is turning into support in the 2020-2030 area. The E-mini has traded between 1960 and 2090 (130 points) since November and crossed the midpoint (2025) at least eight times. The E-mini is once again flirting with this midpoint and trading remains choppy.
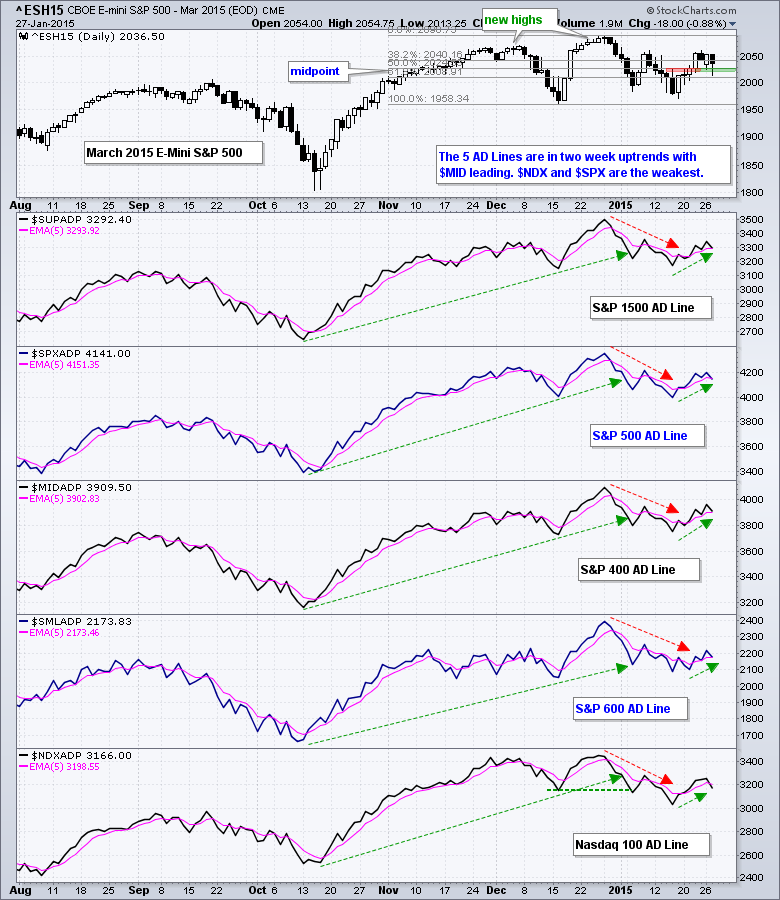
All five AD Lines are in short-term uptrends, but the large-cap AD Lines are starting to weaken a little. The S&P 500 AD Line stalled the last three days and the Nasdaq 100 AD Line fell sharply on Monday-Tuesday. The S&P MidCap AD Line remains the strongest of the five.
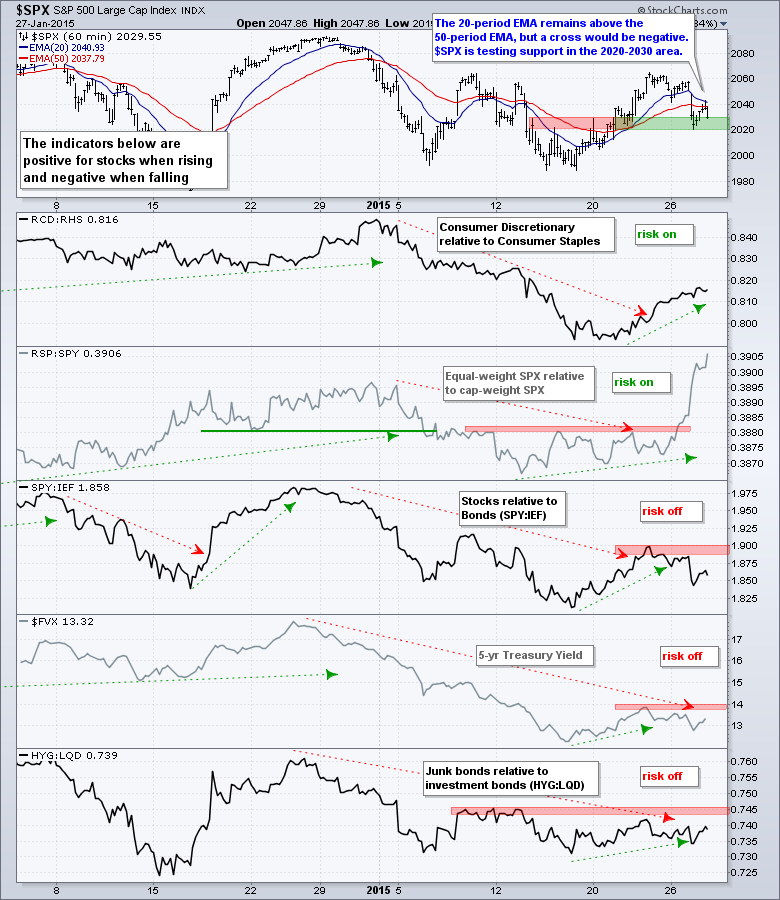
Three of the five risk indicators are negative. The two stock-specific indicators are positive because consumer discretionary is outperforming consumer staples and the Equal-Weight S&P 500 ETF is outperforming the cap-weight S&P 500 ETF. Relative weakness in large-caps stems from disappointing earnings and the negative impact of a strong Dollar. The three bond-related indicators are negative. Stocks have been underperforming Treasuries since late December, the 5-year Treasury Yield has not broken out and junk bonds are underperforming investment grade bonds.
What a mess. SPY and QQQ gapped down and stayed down. Short-term, I must consider these gaps and breakdowns bearish. IWM, on the other hand, remains in a short-term uptrend and shows relative strength. The breadth indicators are pointing up the last two weeks, but the risk indicators are net negative (two positive and three negative). No wonder the stock market is all over the place.
**************************************************************
**************************************************************
**************************************************************
**************************************************************
**************************************************************
**************************************************************
***************************************************************
Key Reports and Events (all times Eastern):
Wed - Jan 28 - 07:00 - MBA Mortgage Index
Wed - Jan 28 - 10:30 - Oil Inventories
Wed - Jan 28 - 14:00 - FOMC Policy Statement
Thu - Jan 29 - 08:30 - Initial Jobless Claims
Thu - Jan 29 - 10:00 - Pending Home Sales
Thu - Jan 29 - 10:30 - Natural Gas Inventories
Fri - Jan 30 - 08:30 - GDP
Fri - Jan 30 - 09:45 - Chicago PMI
Fri - Jan 30 - 09:55 - Michigan Sentiment - Final
This commentary is designed to stimulate thinking. This analysis is not a recommendation to buy, sell, hold or sell short any security (stock ETF or otherwise). We all need to think for ourselves when it comes to trading our own accounts. First, it is the only way to really learn. Second, we are the only ones responsible for our decisions. Think of these charts as food for further analysis. Before making a trade, it is important to have a plan. Plan the trade and trade the plan. Among other things, this includes setting a trigger level, a target area and a stop-loss level. It is also important to plan for three possible price movements: advance, decline or sideways. Have a plan for all three scenarios BEFORE making the trade. Consider possible holding times. And finally, look at overall market conditions and sector/industry performance.


