Stocks started the day with some selling pressure, but firmed around 11AM and moved steadily higher the rest of the day. Small-caps and micro-caps led the way as IWM and IWC gained 1.38% and 1.48%, respectively. The consumer discretionary sector led the SPDRs, the equal-weight sectors and the small-cap sectors. Small-caps and the consumer discretionary sector are benefitting from a strong Dollar and low oil prices. A strong Dollar benefits stocks with a domestic focus and low oil prices put more money in consumer pockets. Note that the Home Construction iShares (ITB) surged over 3% as other homebuilders reported better earnings than KB Home (13-Jan). Even though the market remains a split beast overall, relative strength in the consumer discretionary sector and homebuilders is net positive.
**This chart analysis is for educational purposes only, and should not
be construed as a recommendation to buy, sell or sell-short said securities**
Short-term Overview (Friday, 30-January-2015):
- Four of the five AD Lines formed a lower high from early January to late January.
- The three bond-related risk indicators are negative.
- QQQ and SPY failed to hold their breakouts, gapped down on 28-Jan and remain short-term bearish.
- IWM broke out on 22-Jan and tested this breakout zone.
- TLT fell back on Thursday, but remains in a clear uptrend.
- UUP fell on Tuesday and moved right back to its highs.
- USO got a bounce, but last week's triangle breakdown remains in play.
- GLD broke support on 29-Jan to start a new downtrend.
True to form, the E-mini broke support and then bounced with a 1.33% surge. Once again, the E-mini dipped below 2000 and then recovered. There is a lot of support in this 1980-2000 area for both the E-mini and the S&P 500. Overall, the E-mini remains within a triangle consolidation, which formed after new highs.
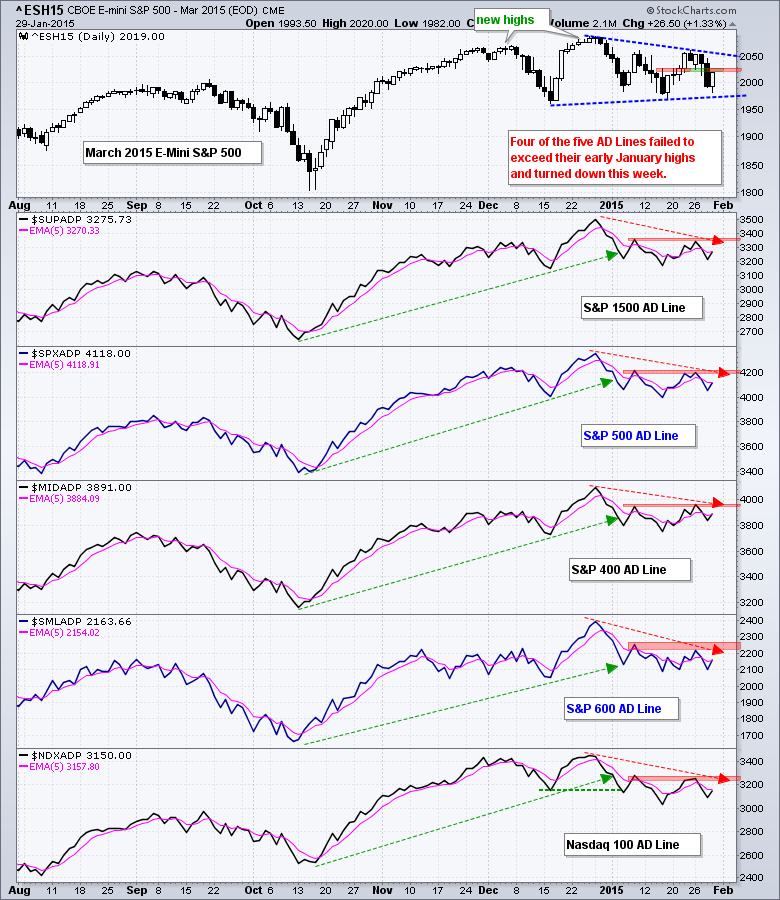
All five AD Lines rebounded, but AD Percent was not that strong on Thursday. S&P SmallCap AD Percent ($SMLADP) finished at +63% to lead. The rest of the AD Percent values were between 55% and 62%. Frankly, I would have like to see a bigger breadth thrust. Overall, four of the five AD Lines are in short-term downtrends with lower highs in January. The January highs mark resistance.

Three of the five risk indicators remain negative. Consumer discretionary continues to outperform consumer staples, and the equal-weight S&P 500 continues to outperform the cap-weight S&P 500. Despite some good stock rotations, there is clearly some risk aversion out there because Treasuries are outperforming stocks, the 5-year Treasury Yield continues to fall and junk bonds are underperforming investment grade bonds.
The short-term evidence is mixed with a bearish edge. The AD Lines, S&P 500 and QQQ are basically flat in January and have a slight downward bias since late December. IWM shows relative strength, but is also essentially flat over the last four weeks. Basically, the stock market is locked in a consolidation pattern and trading remains choppy.

**************************************************************

**************************************************************

**************************************************************

**************************************************************

**************************************************************

**************************************************************

***************************************************************
Key Reports and Events (all times Eastern):
Thu - Jan 29 - 08:30 - Initial Jobless Claims
Thu - Jan 29 - 10:00 - Pending Home Sales
Thu - Jan 29 - 10:30 - Natural Gas Inventories
Fri - Jan 30 - 08:30 - GDP
Fri - Jan 30 - 09:45 - Chicago PMI
Fri - Jan 30 - 09:55 - Michigan Sentiment
This commentary is designed to stimulate thinking. This analysis is not a recommendation to buy, sell, hold or sell short any security (stock ETF or otherwise). We all need to think for ourselves when it comes to trading our own accounts. First, it is the only way to really learn. Second, we are the only ones responsible for our decisions. Think of these charts as food for further analysis. Before making a trade, it is important to have a plan. Plan the trade and trade the plan. Among other things, this includes setting a trigger level, a target area and a stop-loss level. It is also important to plan for three possible price movements: advance, decline or sideways. Have a plan for all three scenarios BEFORE making the trade. Consider possible holding times. And finally, look at overall market conditions and sector/industry performance.


