Stocks moved sharply higher on Thursday with IWM getting the biggest gain among the major index ETFs. Note that IWM and IJR were both up over 2%. Even though these two show relative weakness in January, they typically outperform during a broad market move. The Finance SPDR (XLF) sprang to life and led the sector SPDRs with a 2.5% gain. The Consumer Discretionary SPDR (XLY) and Technology SPDR (XLK) were also strong. Banks seem to be all over the idea of QE from the European Central Bank as the Bank SPDR (KBE) and the Regional Bank SPDR (KRE) surged over 4%. Transports also surged with UPS hitting a new high.
**This chart analysis is for educational purposes only, and should not
be construed as a recommendation to buy, sell or sell-short said securities**
Short-term Overview (Friday, 23-January-2015):
- Four of the five AD Lines are in short-term uptrends.
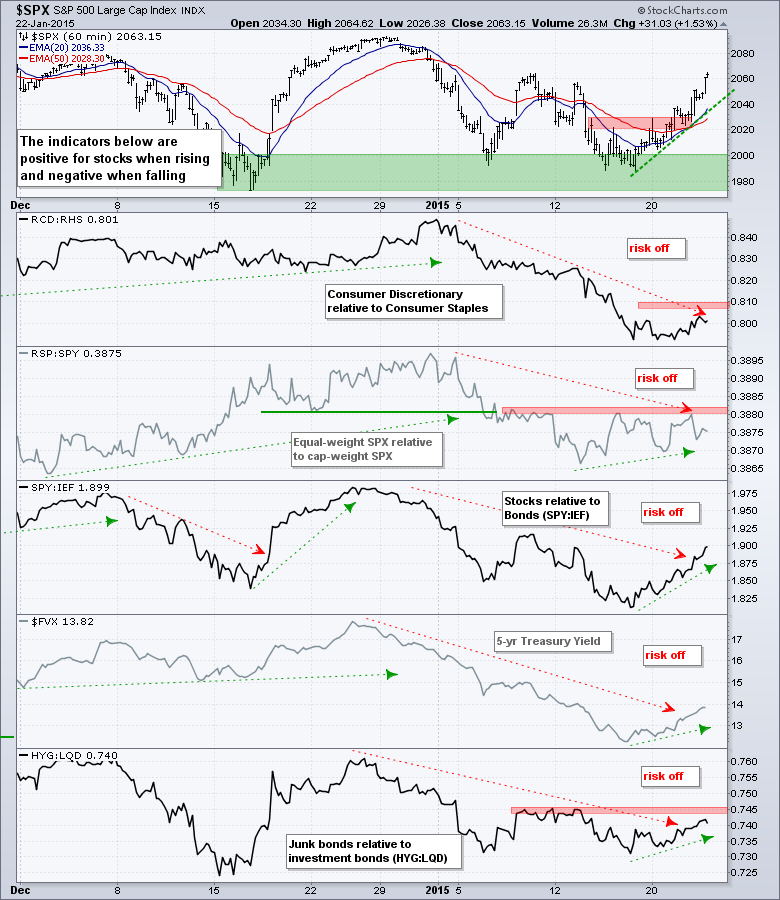
- The risk indicators remain negative, but we are seeing improvement in the bond-related indicators.
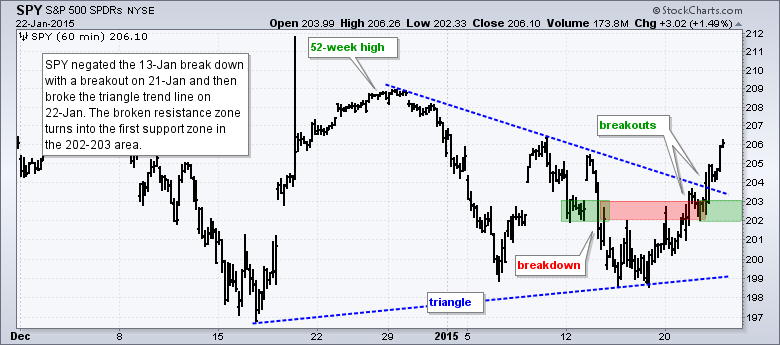
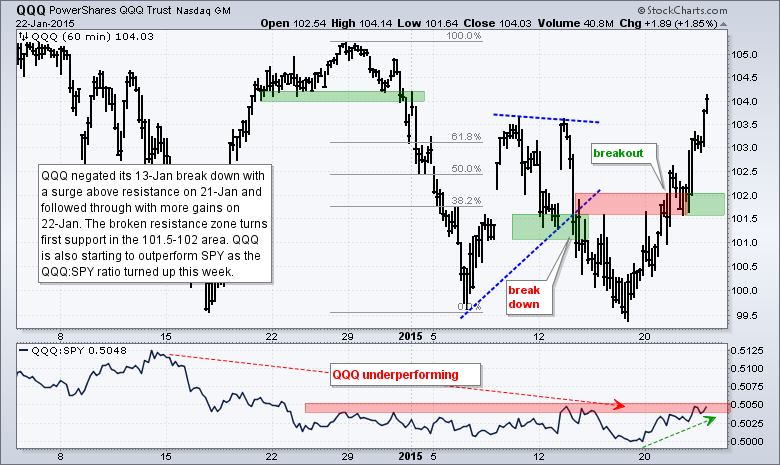
- QQQ and SPY broke out on 21-Jan and the broken resistance zones mark first support.
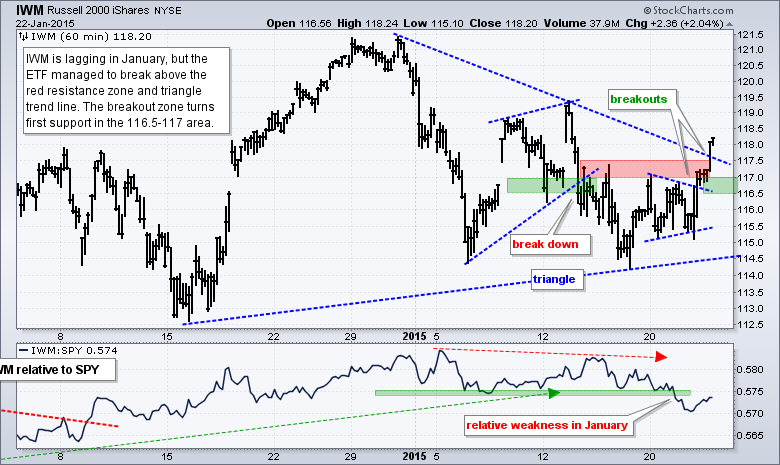
- IWM broke out on 22-Jan and the broken resistance zone marks first support.
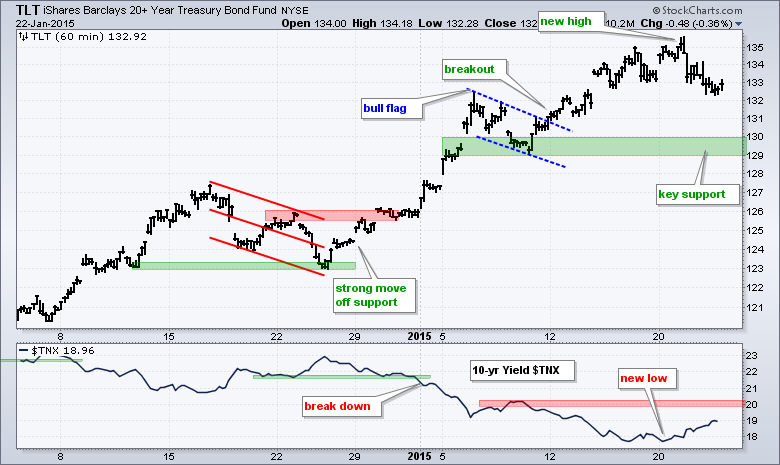
- TLT pulled back this week, but remains in an uptrend overall.
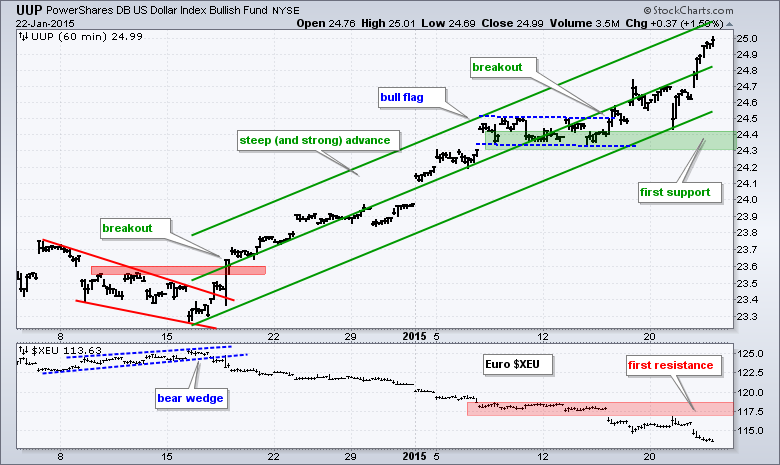
- UUP surged to yet another new high as the Euro plunged to an 11 year low.
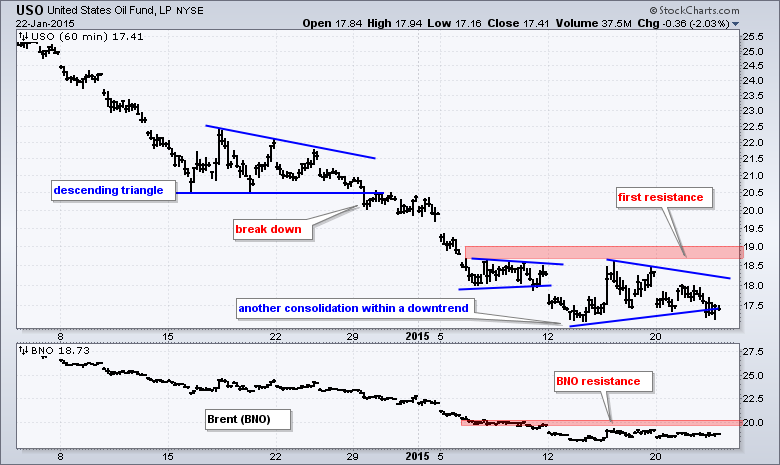
- USO formed a triangle consolidation within its downtrend and tested the lower trend line.
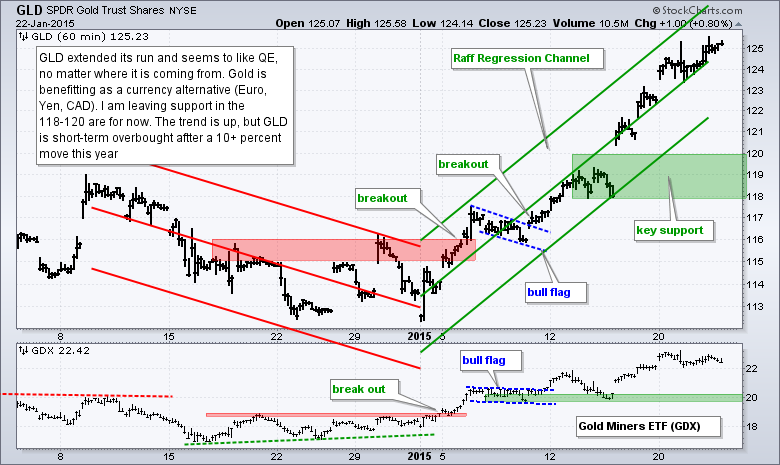
- GLD is in a short-term uptrend, but overbought after a big move.
The E-mini surged above short-term resistance for a breakout. More importantly, perhaps, this move represents follow through to Friday's big advance. So we had a surge off the 2000 area on Friday, a stall on Monday and a small gain on Wednesday. The stock market did not back down after Friday's surge and then followed through on Thursday. Throw in a long-term uptrend and we have a recipe for new highs over the next few weeks.
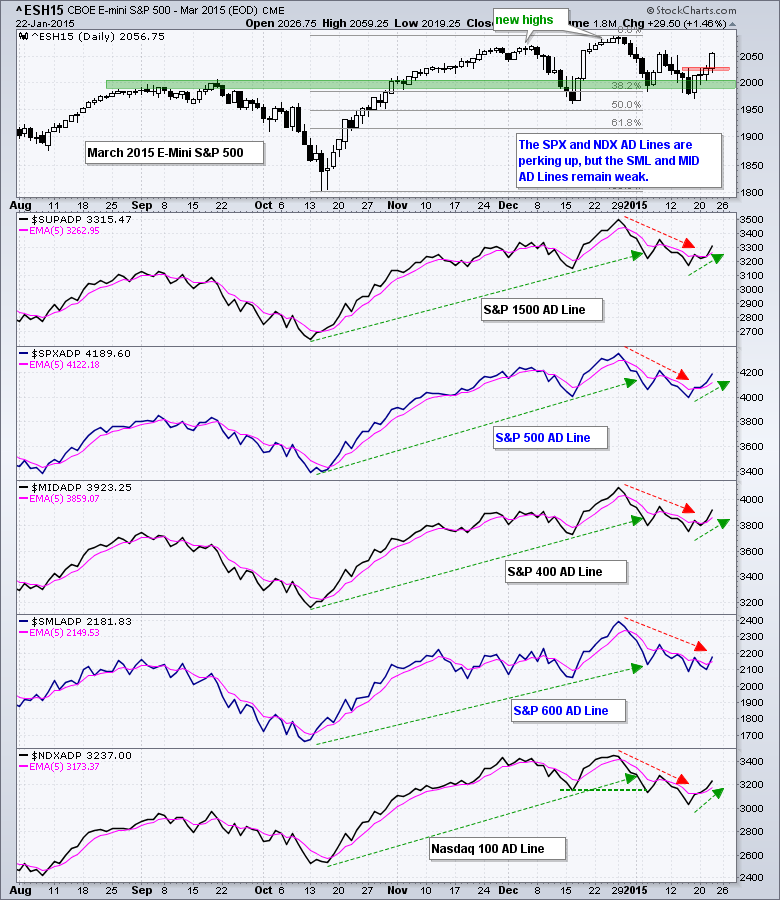
All five AD Lines surged with AD Percent for the S&P MidCap 400 leading the way. At this point, it looks like four of the five AD Lines have started short-term uptrends because they are above their 5-day EMAs and above Friday's high. The S&P Small-Cap 600 AD Line is the exception because it has yet to break above Friday's high. Based on this week's performance, I think the S&P 500 and Nasdaq 100 AD Lines are the strongest (short-term).
Despite a big surge in the stock market, the risk indicators are still negative. The least negative is the SPY:IEF ratio because the S&P 500 SPDR (SPY) has outperformed the 7-10 YR T-Bond ETF (IEF) over the last five days. On the stock side, we have yet to see breakouts in the RSP:SPY ratio (equal-weight relative to cap-weight) or the RCD:RHS ratio (consumer discretionary relative to consumer staples).
The short-term evidence remains mixed, but in favor of the bulls right now. The AD Lines turned up, SPY and QQQ broke out on Thursday and stocks are outperforming bonds. There are some concerns with relative weakness in the equal-weight S&P 500 and the consumer discretionary sector, but the price action for SPY and QQQ is bullish.
**************************************************************
**************************************************************
**************************************************************
**************************************************************
**************************************************************
**************************************************************
***************************************************************
Key Reports and Events (all times Eastern):
Fri - Jan 23 - 10:00 - Existing Home Sales
Fri - Jan 23 - 10:00 - Leading Economic Indicators
Sun - Jan 25 - 09:00 - Greek Election
This commentary is designed to stimulate thinking. This analysis is not a recommendation to buy, sell, hold or sell short any security (stock ETF or otherwise). We all need to think for ourselves when it comes to trading our own accounts. First, it is the only way to really learn. Second, we are the only ones responsible for our decisions. Think of these charts as food for further analysis. Before making a trade, it is important to have a plan. Plan the trade and trade the plan. Among other things, this includes setting a trigger level, a target area and a stop-loss level. It is also important to plan for three possible price movements: advance, decline or sideways. Have a plan for all three scenarios BEFORE making the trade. Consider possible holding times. And finally, look at overall market conditions and sector/industry performance.


