Stocks took a breather on Friday, but the Nasdaq 100 ETF (QQQ) and Russell 2000 Growth iShares (IWO) bucked the selling pressure by producing small gains to end the week. Overall, QQQ led the market last week with a 3.41% gain and the Technology SPDR (XLK) led the sector SPDRs with a 2.65% advance. It is nice to see techs showing relative strength. Elsewhere, the Equal-Weight Consumer Discretionary ETF (RCD) and Equal-weight Industrials ETF (RGI) led the equal-weight sector ETFs. Volatility could be the order of the day on Monday, and perhaps the entire week. In addition to the Greek drama, earnings season is in full gear with hundreds of reports scheduled this week. DR Horton and Microsoft report on Monday, Apple and MMM report on Tuesday, and Boeing and Lam Research report on Wednesday. Earnings reports have been less than spectacular so far, but the stock market is holding up pretty well considering.
**This chart analysis is for educational purposes only, and should not
be construed as a recommendation to buy, sell or sell-short said securities**
Short-term Overview (Monday, 26-January-2015):
- Four of the five AD Lines are in short-term uptrends.
- The risk indicators remain negative, but we saw some improvement last week.
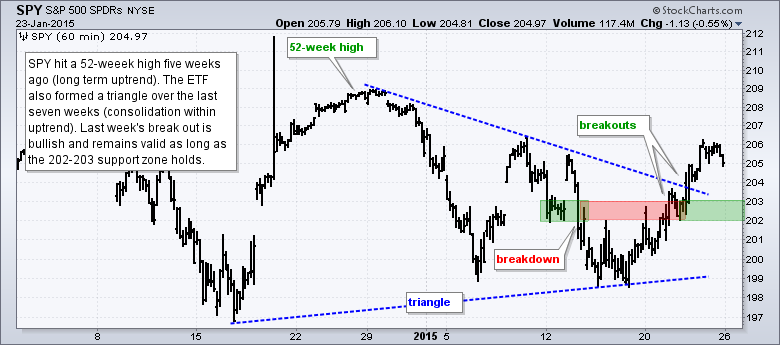
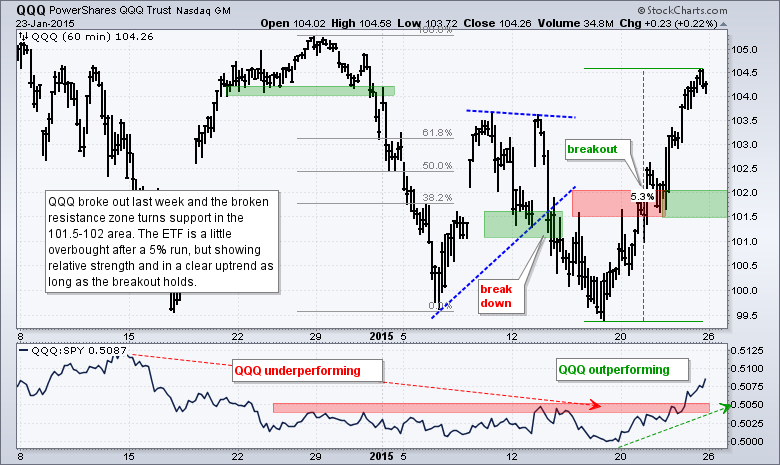
- QQQ and SPY broke out on 21-Jan and these breakouts are valid as long as they hold.
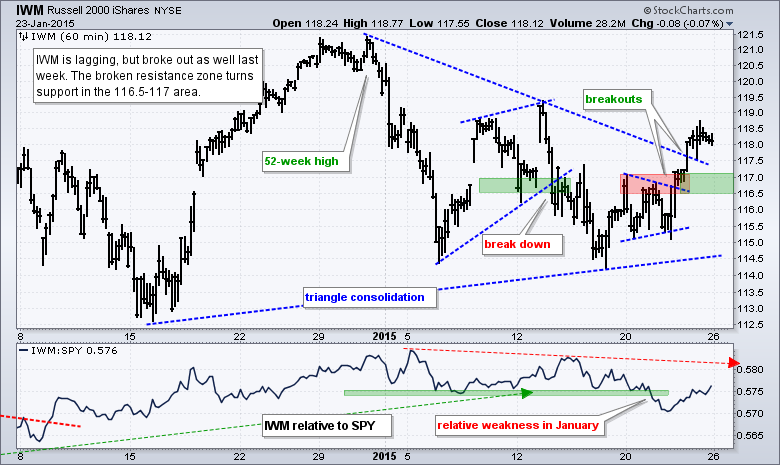
- IWM broke out on 22-Jan and the broken resistance zone marks first support.
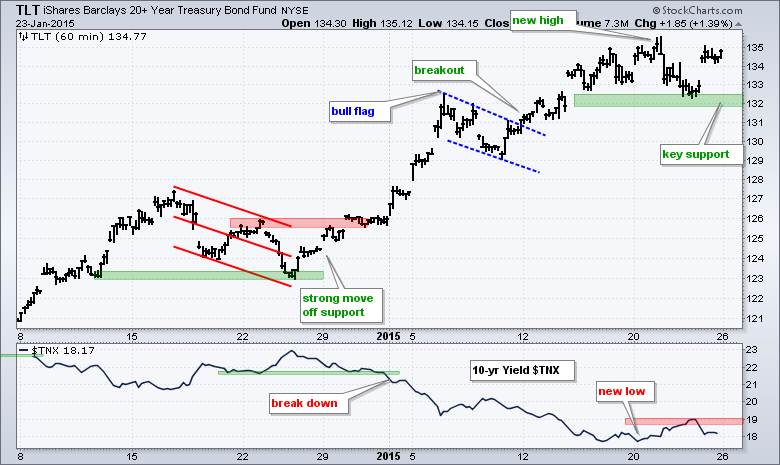
- TLT surged on Friday and I raised key support.
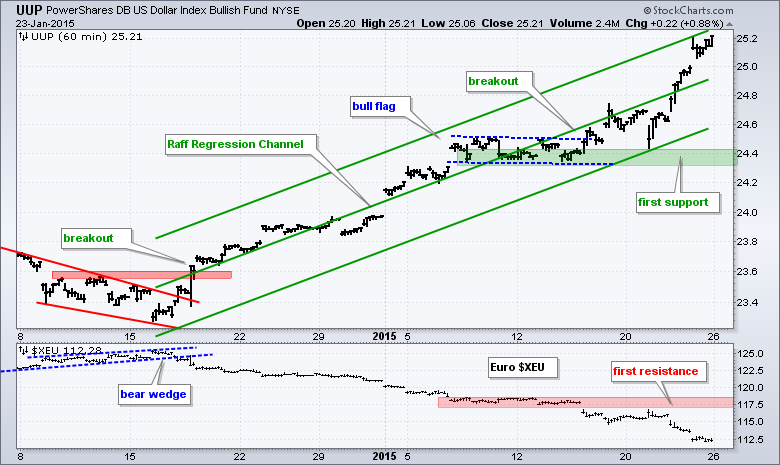
- UUP surged to yet another new high as the Euro plunged to an 11 year low.
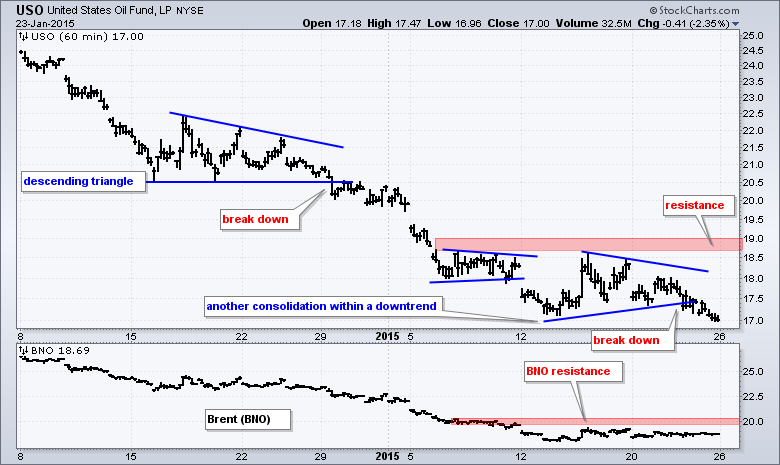
- USO formed a triangle consolidation within its downtrend and broke the lower trend line on Friday.
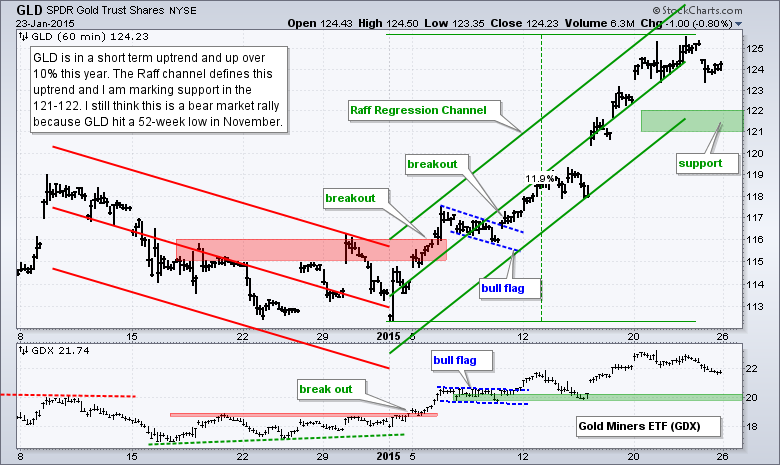
- GLD is in a short-term uptrend defined by a Raff Regression Channel.
The E-mini broke out with a five day advance and then fell back on Friday. A rest after a four percent advance is normal. The broken resistance zone around 2020-2030 is the first level to watch. A strong bounce off the 2000 support zone should hold this first breakout. A move back below 2020 would call for a reassessment.
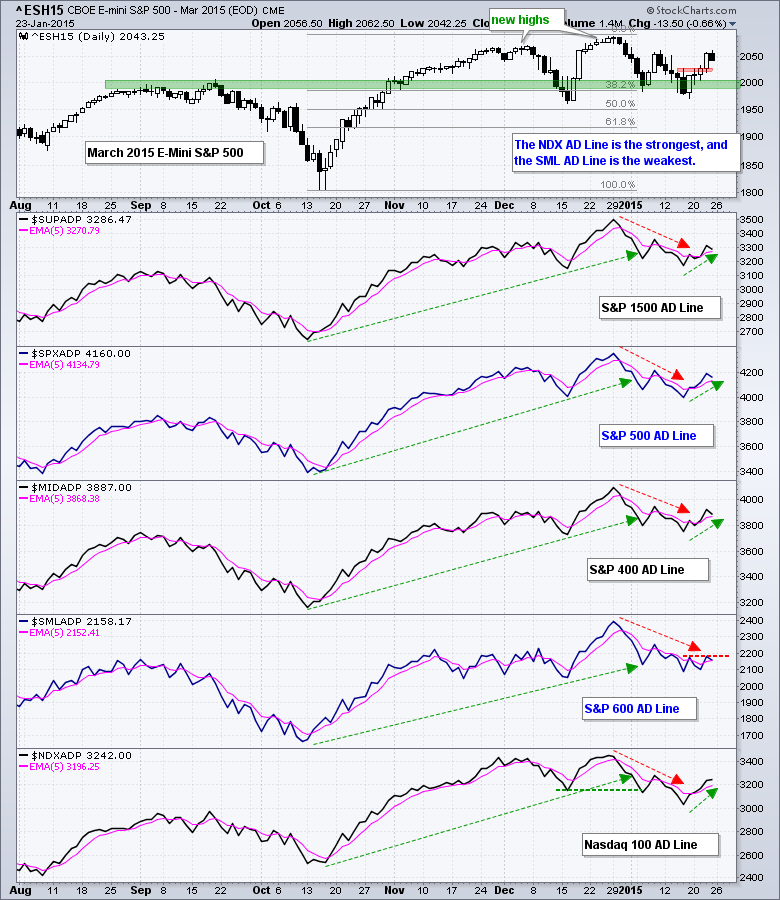
Four of the five AD Lines are in short-term upswings with the Nasdaq 100 AD Line leading. Friday's AD Percent was negative for the S&P 500, S&P MidCap 400 and S&P Small-Cap 600, but positive for the Nasdaq 100 (+5%). Even though it was barely positive, it bucked overall selling pressure and suggests some relative strength in large-cap techs. The S&P Small-Cap 600 AD Line is the only one that remains in a downswing because it has yet to get a short-term break out.
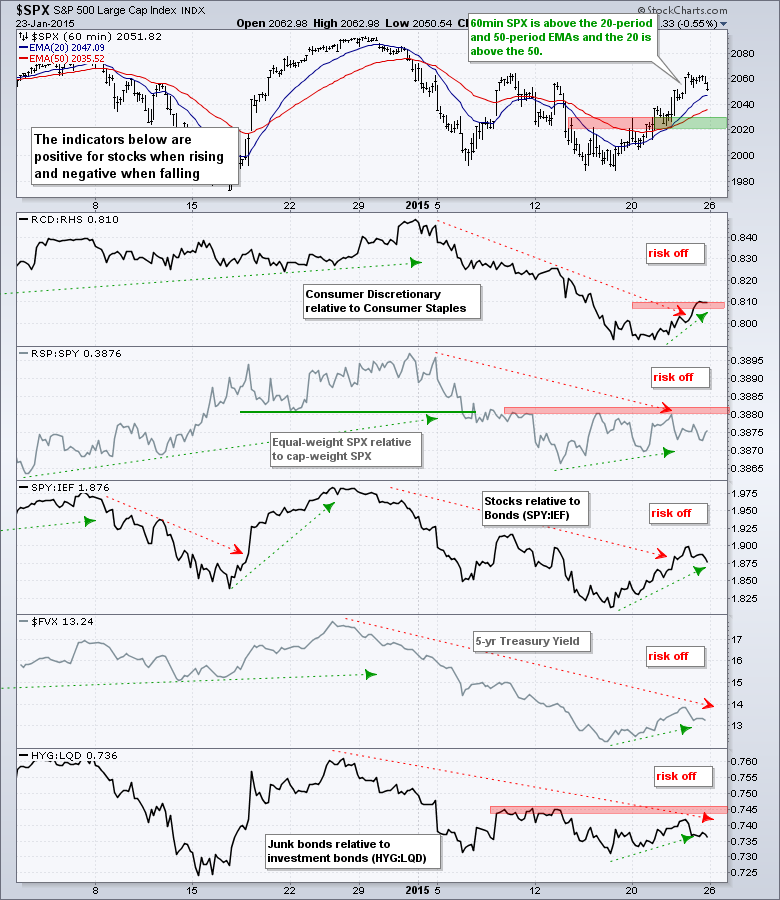
The short-term risk indicators are a bit difficult to assess right now. The red lines with arrows show a risk off environment for stocks from late December to mid January, but the green lines show an improvement over the past week. The consumer discretionary sector has been underperforming the consumer staples sector and the S&P 500 Equal-Weight Index has been lagging the cap-weight S&P 500 this month. These two are still clearly negative. The SPY:IEF ratio and the 5-year Treasury Yield ($FVX) fell from late December to mid January and then bounced last week as stocks outperformed Treasuries and short-term yields rose. This one week rise, however, is not enough to turn positive on these two risk indicators because last week's bounce could be a counter trend move. Today will provide a test because the markets are feeling a little risk averse after the Greek election results.
The short-term evidence favors the bulls, but there are some negative pockets out there that could keep trading choppy. QQQ, IWM and SPY broke out last week with QQQ leading the charge, and IWM lagging. These breakouts are bullish until proven otherwise and I am marking support near the breakouts. Keep your eyes on the price charts and ignore the media circus.
**************************************************************
**************************************************************
**************************************************************
**************************************************************
**************************************************************
**************************************************************
***************************************************************
Key Reports and Events (all times Eastern):
Tue - Jan 27 - 08:30 - Durable Goods Orders
Tue - Jan 27 - 09:00 - Case-Shiller Housing Index
Tue - Jan 27 - 10:00 - Consumer Confidence
Tue - Jan 27 - 10:00 - New Home Sales
Wed - Jan 28 - 07:00 - MBA Mortgage Index
Wed - Jan 28 - 10:30 - Oil Inventories
Wed - Jan 28 - 14:00 - FOMC Policy Statement
Thu - Jan 29 - 08:30 - Initial Jobless Claims
Thu - Jan 29 - 10:00 - Pending Home Sales
Thu - Jan 29 - 10:30 - Natural Gas Inventories
Fri - Jan 30 - 08:30 - GDP
Fri - Jan 30 - 09:45 - Chicago PMI
Fri - Jan 30 - 09:55 - Michigan Sentiment - Final
This commentary is designed to stimulate thinking. This analysis is not a recommendation to buy, sell, hold or sell short any security (stock ETF or otherwise). We all need to think for ourselves when it comes to trading our own accounts. First, it is the only way to really learn. Second, we are the only ones responsible for our decisions. Think of these charts as food for further analysis. Before making a trade, it is important to have a plan. Plan the trade and trade the plan. Among other things, this includes setting a trigger level, a target area and a stop-loss level. It is also important to plan for three possible price movements: advance, decline or sideways. Have a plan for all three scenarios BEFORE making the trade. Consider possible holding times. And finally, look at overall market conditions and sector/industry performance.
