Stocks managed to claw out some gains with large-caps leading the way. SPY and QQQ gained around a half percent. Small-caps were weak as IWM fell .32%. The gains and losses were small and not that significant. Energy, materials and utilities led the market higher. This is not the crew we want to see in the driver's seat, but all sector SPDRs and equal-weight sector ETFs managed to gain ground. Small-caps were another story because only two of the nine small-cap sectors gained (energy and materials). Once again, the split market creates a choppy trading environment that makes short-term trading a challenge.
**This chart analysis is for educational purposes only, and should not
be construed as a recommendation to buy, sell or sell-short said securities**
Short-term Overview (Thursday, 22-January-2015):
- The AD Lines are in short-term downtrends, but large-cap breadth is improving.
- The risk indicators remain negative overall, but show some improvement the last few days.
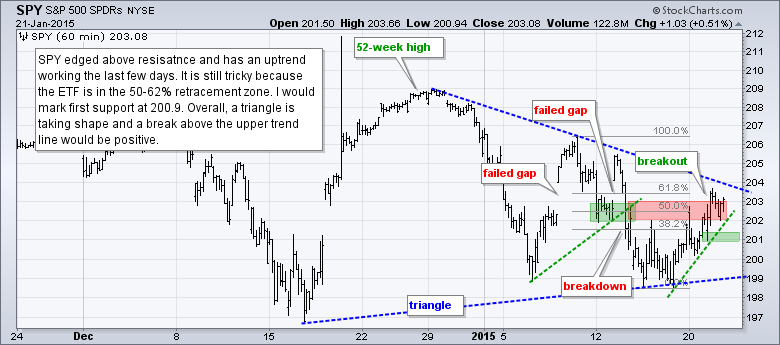
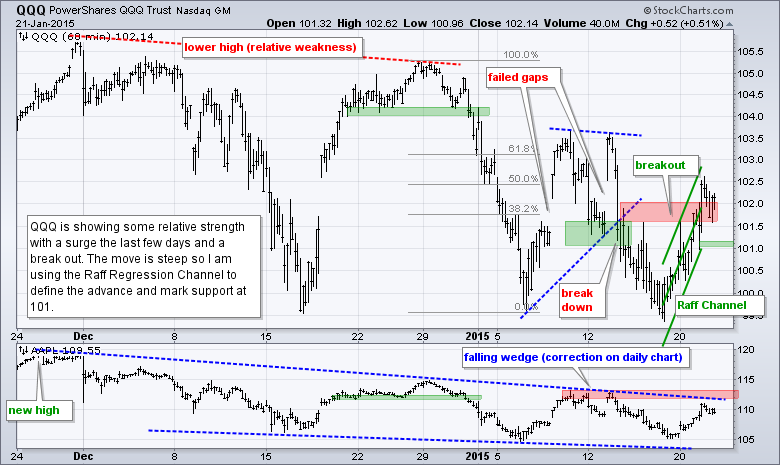
- QQQ and SPY negated last week's break down with breakouts on Wednesday.
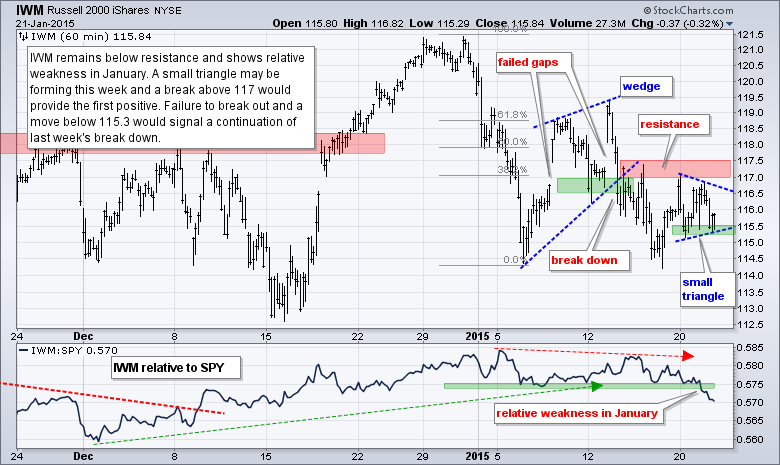
- IWM remains below resistance, has yet to reverse last week's breakout and shows relative weakness.
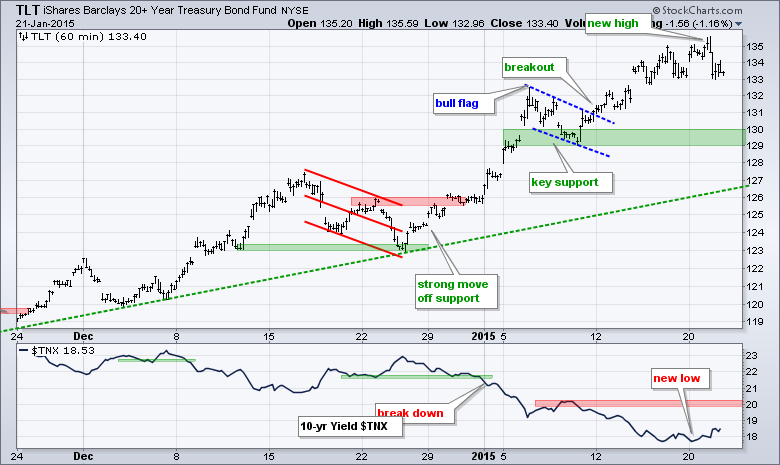
- TLT broke flag resistance on 12-Jan and hit another new high on Wednesday.
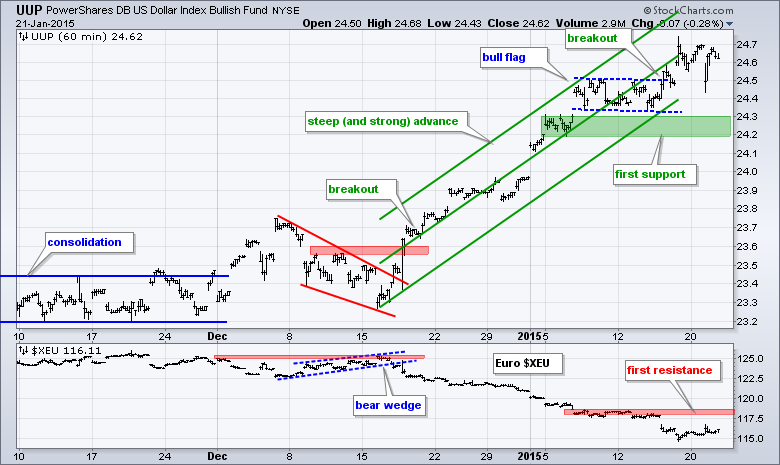
- UUP broke flag resistance last week and this breakout is holding.
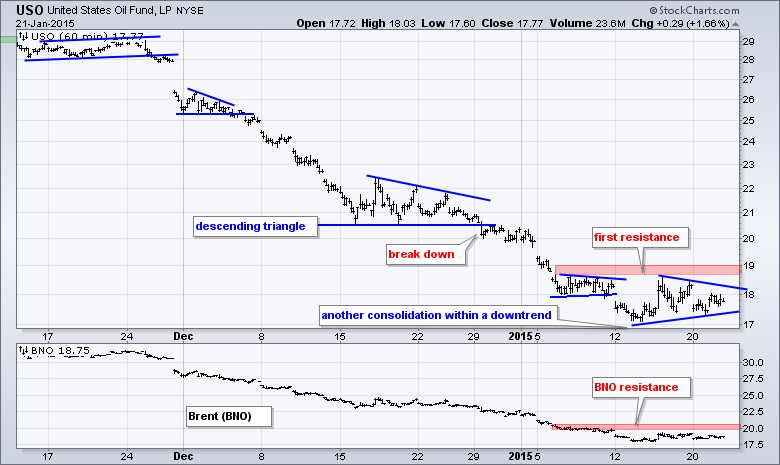
- USO is forming another consolidation in its downtrend.
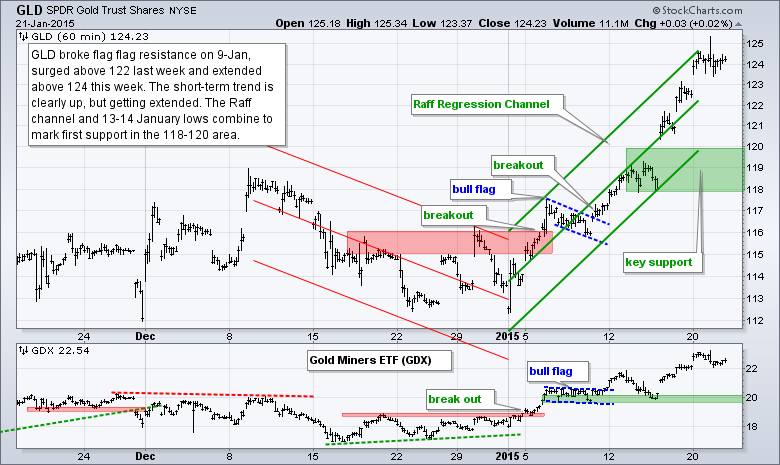
- GLD extended its short-term uptrend and I am marking support in the 118-120 area.
The E-mini extended its bounce for the third day running. Once again, the 2000 area is acting as support and the E-mini is working on a short-term breakout. It is also working on follow through to Friday's big advance. Overall, the gains since Friday's close have held and this is positive.
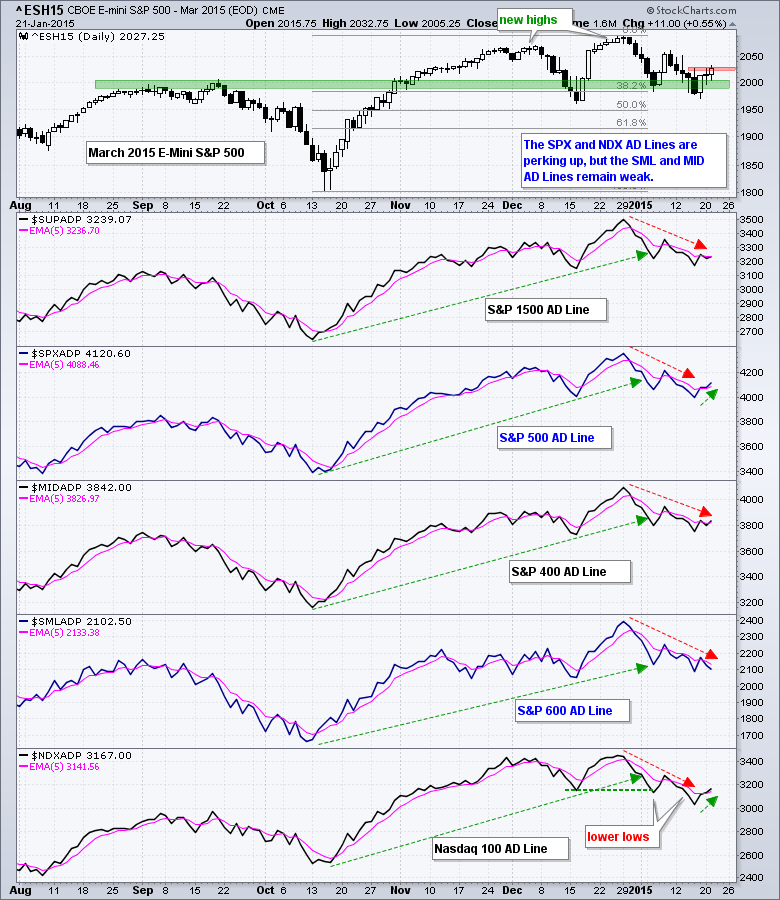
The AD Lines are mixed with two showing some strength and two remaining weak. Breadth was net positive on Wednesday, but small-cap breadth was weak once again. AD Percent for the S&P 1500, S&P 500, S&P MidCap 400 and Nasdaq 100 finished positive, but AD Percent for the S&P Small-Cap 600 finished negative. Large-cap breadth has ticked higher the last three days and I dare to say that the AD Lines for the S&P 500 and Nasdaq 100 are the strongest of the group. Both broke their 5-day EMAs last week and held the break over the last two days. The S&P Small-Cap 600 AD Line is in a downtrend, the S&P MidCap 400 is caught in the middle and the S&P 1500 AD Line is a whisker above its 5-day EMA.
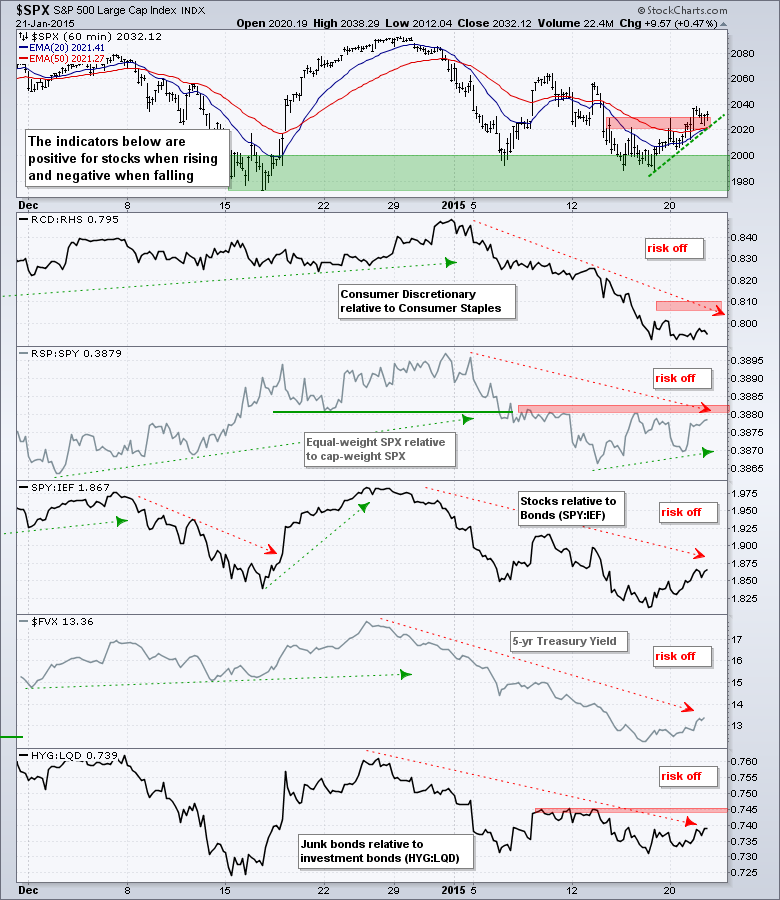
All five risk indicators remain negative (risk off), but we are seeing some improvement over the last few days. Consumer discretionary continues to lag consumer staples and this is the weakest of the five. The Equal-Weight S&P 500 ETF has been underperforming the S&P 500 SPDR this year, but the RSP:SPY ratio firmed the last six days and may be forming a higher low. Likewise, the stock-bond ratio (SPY:IEF) is in a downtrend since late December, but turned up the last few days, as did the 5-year Treasury Yield ($FVX) and the HYG:LQD ratio (junk versus investment grade). The improvement over the last few days, however, is not enough to change these indicators from negative to positive. I am looking for a little more follow through.
The short-term evidence is now mixed for stocks. The E-mini and S&P 500 are getting their bounces off support in the 2000 area, and the Nasdaq 100 is showing strength the last few days. Small-caps, however, are lagging and IWM has failed to break out. We are also seeing relative strength in large-cap breadth the last three days and relative weakness in small-cap breadth. The risk indicators are negative, but show improvement over the last few days. As noted above, trading could remain choppy because the overall market is quite mixed, earnings season is in full swing and the European Central Bank (ECB) makes its policy statement today. The ECB may be important if one trades Europe, currencies and gold, but I think it is just a side show (distraction) when trading US equities.
**************************************************************
**************************************************************
**************************************************************
**************************************************************
**************************************************************
**************************************************************
***************************************************************
Key Reports and Events (all times Eastern):
Wed - Jan 21 - 07:00 - MBA Mortgage Index
Wed - Jan 21 - 08:30 - Housing Starts/Building Permits
Thu - Jan 22 - 08:00 - European Central Bank (ECB) Meeting
Thu - Jan 22 - 08:30 - Initial Jobless Claims
Thu - Jan 22 - 09:00 - FHFA Housing Price Index
Thu - Jan 22 - 10:30 - Natural Gas Inventories
Thu - Jan 22 - 11:00 - Oil Inventories
Fri - Jan 23 - 10:00 - Existing Home Sales
Fri - Jan 23 - 10:00 - Leading Economic Indicators
Sun - Jan 25 - 09:00 - Greek Election
This commentary is designed to stimulate thinking. This analysis is not a recommendation to buy, sell, hold or sell short any security (stock ETF or otherwise). We all need to think for ourselves when it comes to trading our own accounts. First, it is the only way to really learn. Second, we are the only ones responsible for our decisions. Think of these charts as food for further analysis. Before making a trade, it is important to have a plan. Plan the trade and trade the plan. Among other things, this includes setting a trigger level, a target area and a stop-loss level. It is also important to plan for three possible price movements: advance, decline or sideways. Have a plan for all three scenarios BEFORE making the trade. Consider possible holding times. And finally, look at overall market conditions and sector/industry performance.


