Stocks started the day weak, but quickly found their footing and moved higher the rest of the day. Despite this recovery, QQQ ended the day with a fractional loss and SPY closed with a fractional gain. Small-caps and mid-caps were another story as IWM gained 1% and MDY led with a 1.18% advance. The consumer discretionary sector got a bounce on Monday with help from homebuilders and retailers. Big banks and regional banks lifted the finance sector. Biotechs continued to lead the market as XBI surged 2.83% and hit another new high. REITs, Biotechs and Healthcare Providers are the three strongest groups in the market right now.
**This chart analysis is for educational purposes only, and should not
be construed as a recommendation to buy, sell or sell-short said securities**
Short-term Overview (Tuesday, 27-January-2015):
- All five AD Lines are in short-term uptrends.
- The risk indicators are split with two positive, two negative and one neutral.
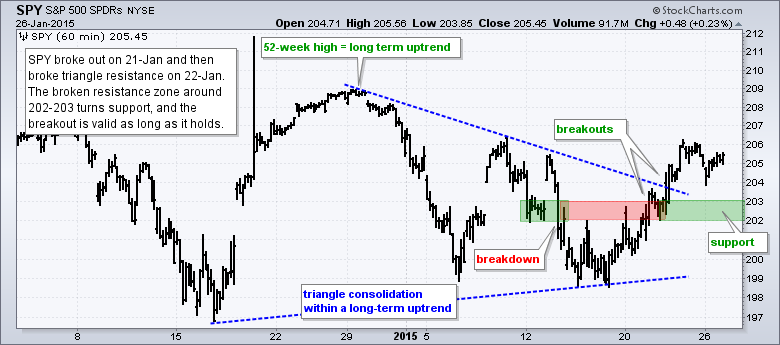
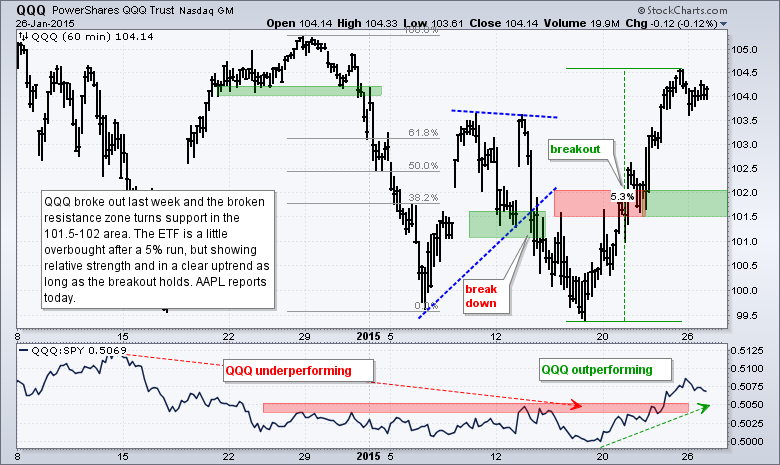
- QQQ and SPY broke out on 21-Jan and these breakouts are holding.
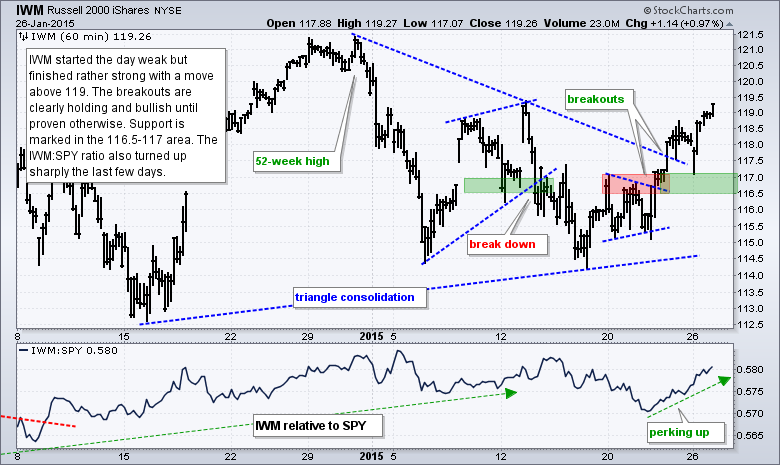
- IWM broke out on 22-Jan and shows relative strength the last few days.
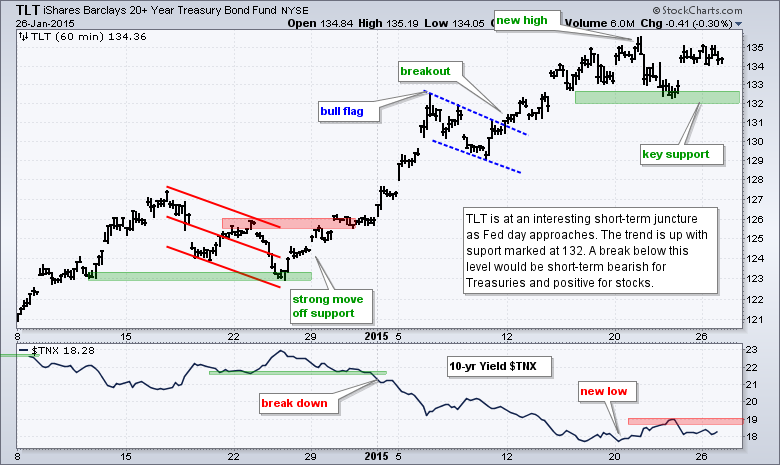
- TLT is stalling ahead of the Fed statement and I am watching support closely.
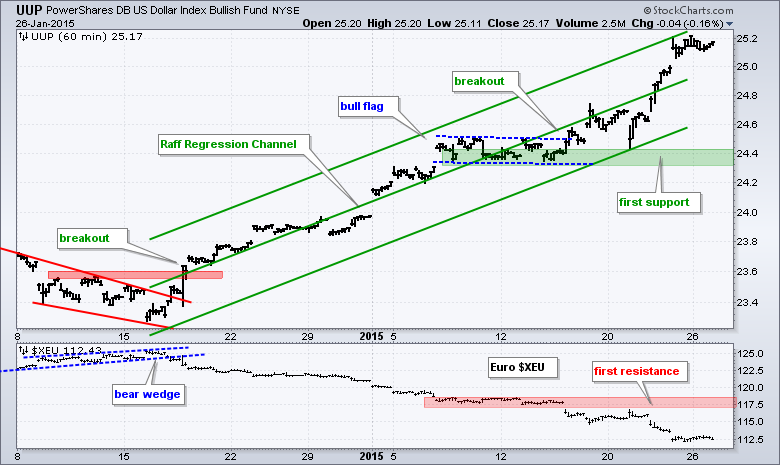
- UUP hit yet another new high as the Euro hit an 11 year low.
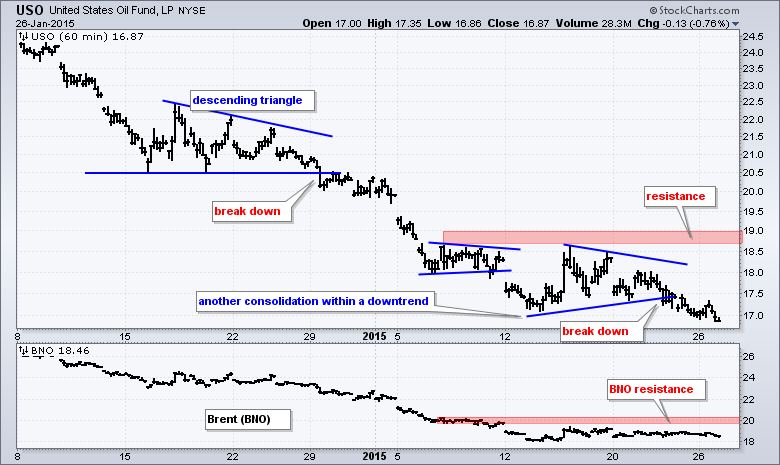
- USO formed a triangle consolidation within its downtrend and broke the lower trend line on Friday.
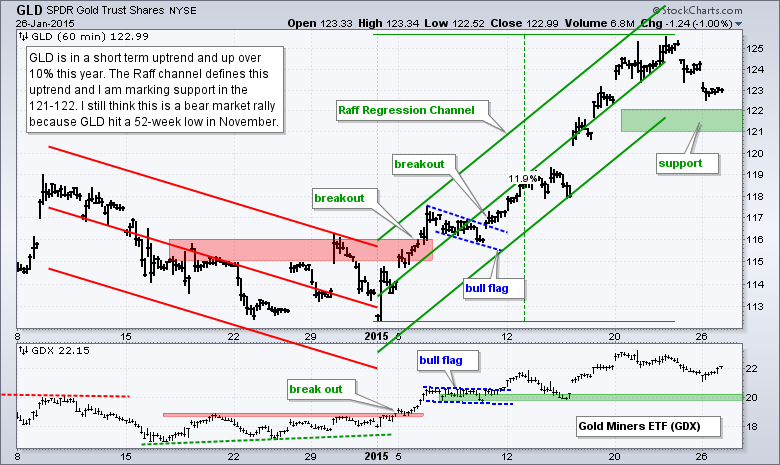
- GLD is in a short-term uptrend defined by a Raff Regression Channel.
The E-mini broke out last week and tested this breakout with a dip below 2030 on Monday. The dip did not last long as the E-mini bounced and closed near the high of the day. The ability to recover after early weakness is positive and keeps the short-term breakout alive.
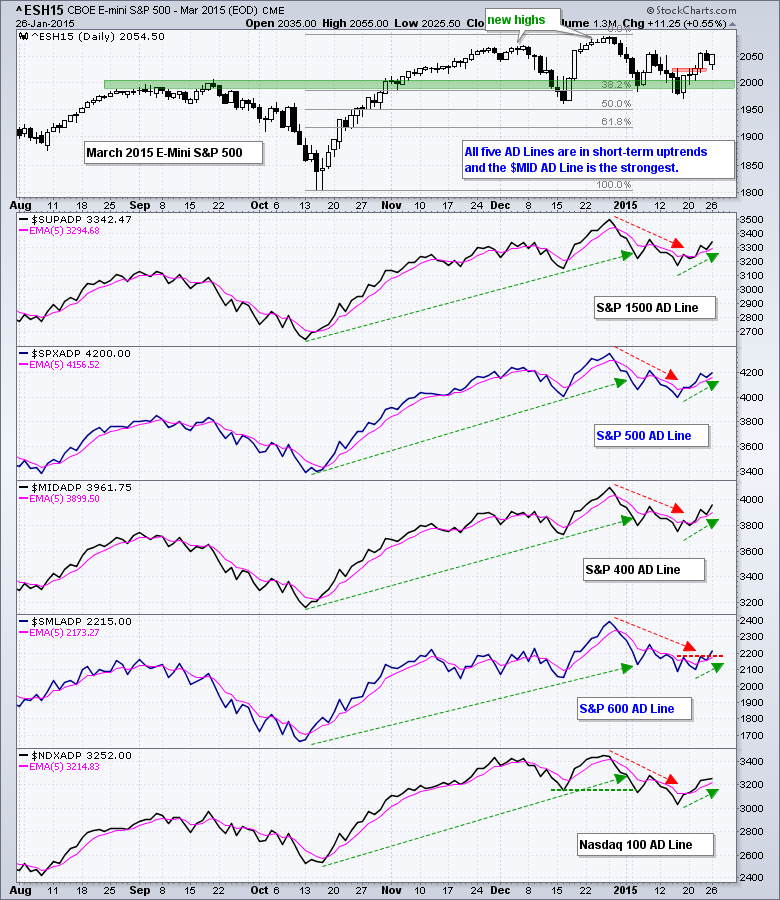
All five AD Lines are in short-term uptrends as the S&P Small-Cap AD Line broke above last week's peak. There is, however, a new leader in town. The S&P MidCap AD Line is the strongest over the last six days because it is the only one to exceed its early January high. In a rather strange twist, the S&P Small-Cap AD Line is the weakest of the five.
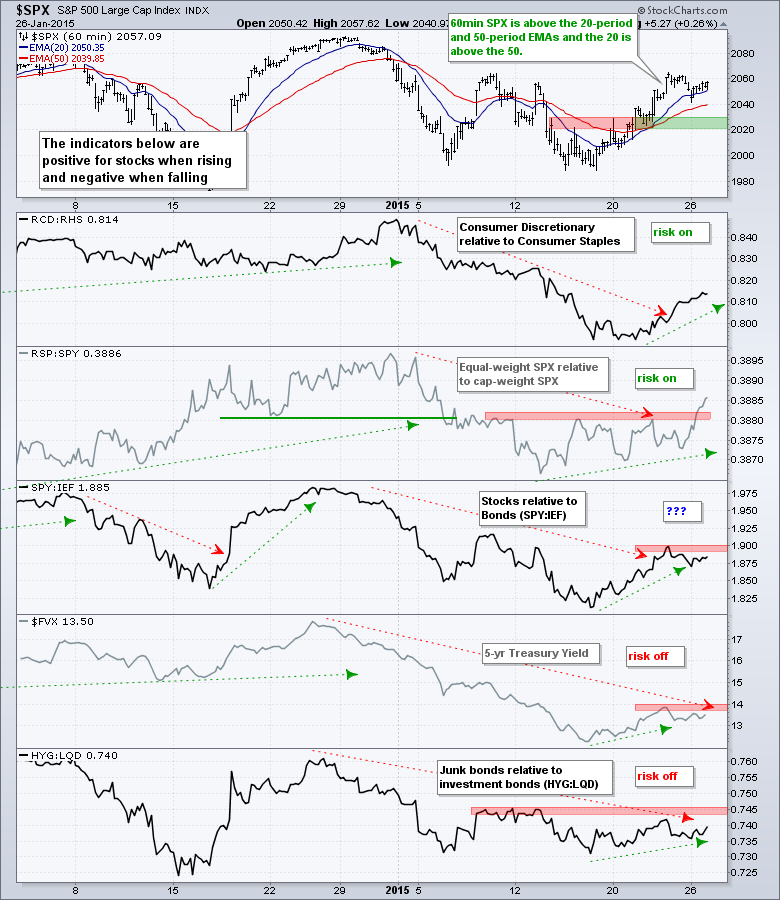
The short-term risk indicators are split, but the two stock-specific indicators are now positive. Consumer discretionary has been outperforming consumer staples for a week now and the RSP:SPY ratio broke out with a surge on Monday. Relative strength in the Equal-Weight S&P 500 ETF stems from relative strength in mid-caps and this suggests that equity traders are taking more risk by betting on higher beta stocks. The two bond-specific indicators are negative, while the stock-bond hybrid is neutral. I am not quite ready to turn positive on the SPY:IEF ratio and would like to see a break above last week's high before doing so.
The short-term evidence favors the bulls. SPY, IWM and QQQ broke out last week and these breakouts are holding. The AD Lines are moving higher with mid-caps leading. Small-caps are starting to lead again on the price charts (IWM:SPY ratio). The risk indicators may be split, but the two stock-specific indicators are bullish. Trading could remain choppy, but I still see an upward bias for stocks. Apple reports after the close today and the Fed makes its policy statement on Wednesday.
**************************************************************
**************************************************************
**************************************************************
**************************************************************
**************************************************************
**************************************************************
***************************************************************
Key Reports and Events (all times Eastern):
Tue - Jan 27 - 08:30 - Durable Goods Orders
Tue - Jan 27 - 09:00 - Case-Shiller Housing Index
Tue - Jan 27 - 10:00 - Consumer Confidence
Tue - Jan 27 - 10:00 - New Home Sales
Wed - Jan 28 - 07:00 - MBA Mortgage Index
Wed - Jan 28 - 10:30 - Oil Inventories
Wed - Jan 28 - 14:00 - FOMC Policy Statement
Thu - Jan 29 - 08:30 - Initial Jobless Claims
Thu - Jan 29 - 10:00 - Pending Home Sales
Thu - Jan 29 - 10:30 - Natural Gas Inventories
Fri - Jan 30 - 08:30 - GDP
Fri - Jan 30 - 09:45 - Chicago PMI
Fri - Jan 30 - 09:55 - Michigan Sentiment - Final
This commentary is designed to stimulate thinking. This analysis is not a recommendation to buy, sell, hold or sell short any security (stock ETF or otherwise). We all need to think for ourselves when it comes to trading our own accounts. First, it is the only way to really learn. Second, we are the only ones responsible for our decisions. Think of these charts as food for further analysis. Before making a trade, it is important to have a plan. Plan the trade and trade the plan. Among other things, this includes setting a trigger level, a target area and a stop-loss level. It is also important to plan for three possible price movements: advance, decline or sideways. Have a plan for all three scenarios BEFORE making the trade. Consider possible holding times. And finally, look at overall market conditions and sector/industry performance.


