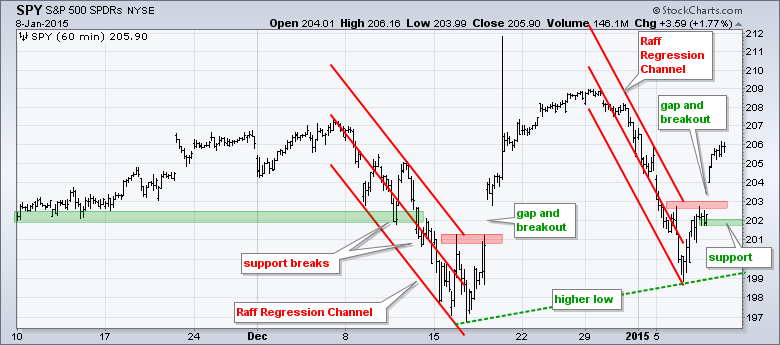
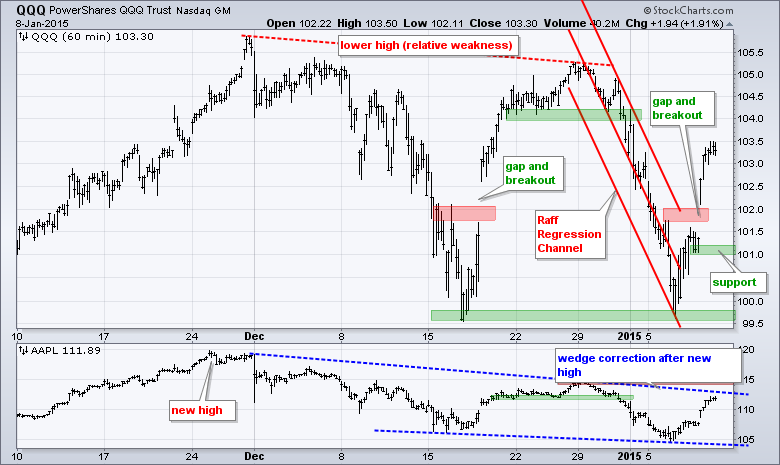
It is just like mid December as SPY, IWM and QQQ fell sharply and then suddenly reversed with a two-day surge. As with mid December, traders not getting in before the gap are now stuck wondering how to play this reversal, especially with the employment report on deck this morning. At this point, the gaps and breakouts are bullish until proven otherwise. This means it is important that the gaps hold. A move back into the gap zone would be negative and a move below Wednesday's close would fully negate the breakouts. Thursday's surge was pretty impressive with all sectors rising (SPDRs, equal-weights and small-caps). The Home Construction iShares (ITB) broke out above its late November high and the Retail SPDR (XRT) closed at a 52-week (closing) high. Also note that some 70 stocks hit all time highs on Thursday All time highs do not occur in bear markets or in downtrends.
**This chart analysis is for educational purposes only, and should not
be construed as a recommendation to buy, sell or sell-short said securities**
Short-term Overview (Friday, 9-January-2015):
- All five AD Lines turned up and broke their 5-day EMAs.
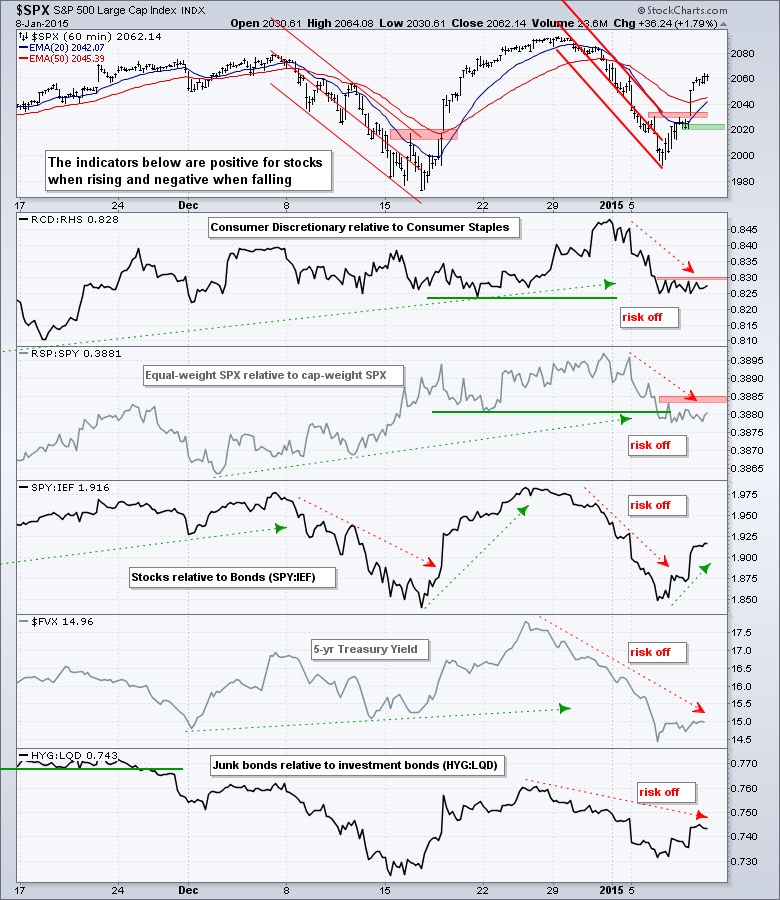
- The risk indicators remain negative overall.
- SPY broke out with a gap and support is set at 202.
- QQQ broke out with a gap and support is set at 101.
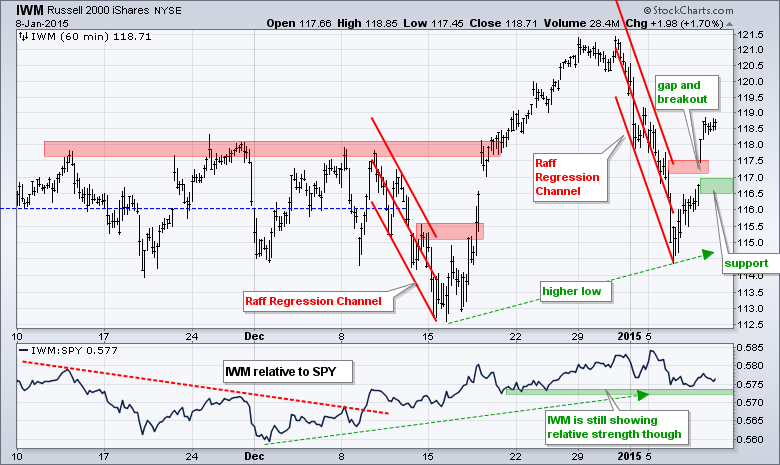
- IWM broke out with a gap and support is set at 116.50
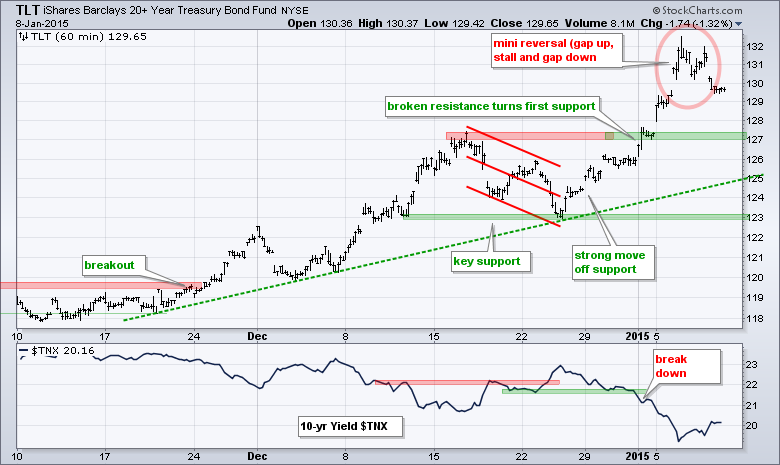
- TLT remains in an uptrend, but forged a small reversal with two gaps.
- UUP remains in a strong uptrend, but is also getting overextended and ripe for a rest.
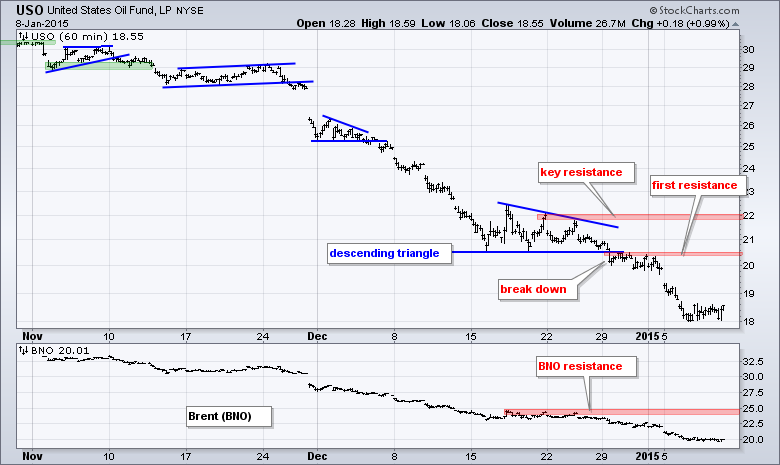
- USO broke descending triangle support in late December and continued its downtrend.
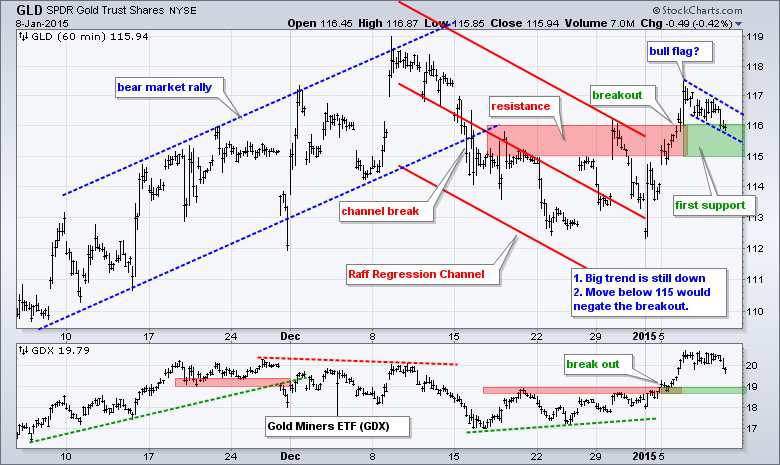
- GLD reversed its downtrend with a breakout on 6-Jan and needs to hold 115 to keep this breakout alive.
The E-mini followed through on its support bounce with a break above the upper trend line of the Raff Regression Channel. This officially reverses the short-term downtrend and I would use Thursday's low as the first level to watch. A move below this low (2020) would negate the breakout and call for a reassessment.
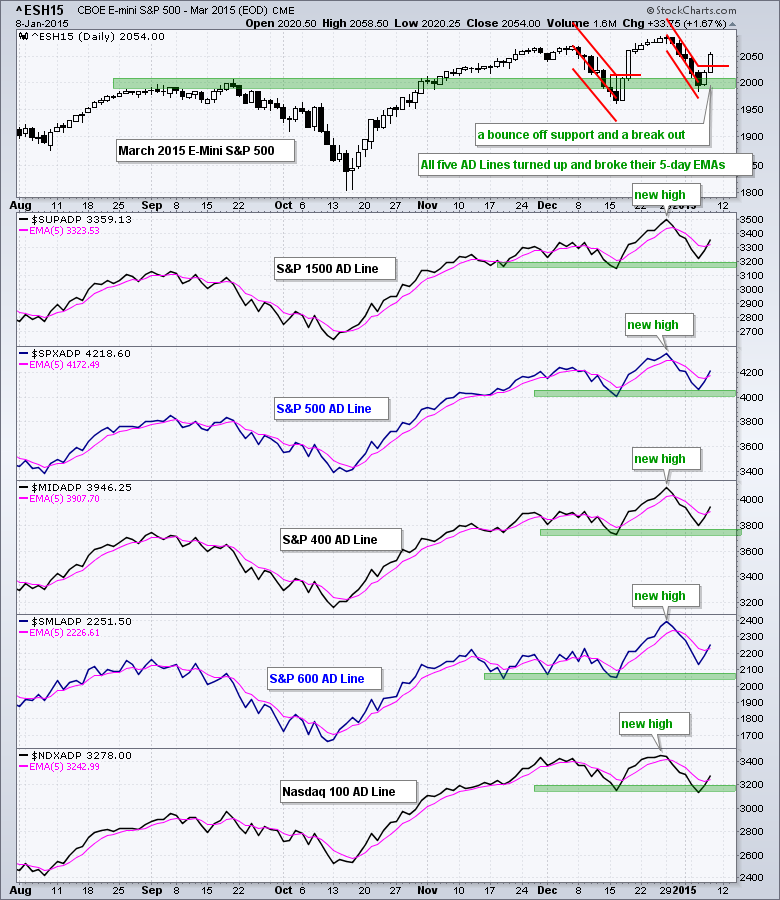
All five AD Lines bounced on Wednesday-Thursday and broke above their 5-day EMAs. Also note that four of the five held above their mid December lows and remain in uptrends overall. The Nasdaq 100 AD Line was the weakest of the five because it broke its mid December low.
The risk indicators are more negative than positive right now. Even though the market surged, the Equal-Weight Consumer Discretionary ETF (RCD) did not outperform the Equal-weight Consumer Staples ETF (RHS) over the last two days. The Equal-Weight S&P 500 ETF (RSP) did not outperform the S&P 500 SPDR (SPY) either. I would have expected some leadership from the consumer discretionary sector and the equal-weight S&P 500. The 5-year Treasury Yield ($FVX) remains in a downtrend since 26-Dec.
At this point, the bulk of the short-term evidence is bullish. The AD Lines and breakouts in the major index ETFs trump the negatives seen in the risk indicators. Also keep in mind that the long-term trends are clearly up as SPY and IWM hit new 52-week highs just a few weeks ago.
The next segment shows the key charts with detailed annotations describing the developments.
**************************************************************
**************************************************************
**************************************************************

**************************************************************
**************************************************************
**************************************************************
***************************************************************
Key Reports and Events (all times Eastern):
Fri - Jan 09 - 08:30 - Nonfarm Payrolls
Fri - Jan 09 - 10:00 - Wholesale Inventories
This commentary is designed to stimulate thinking. This analysis is not a recommendation to buy, sell, hold or sell short any security (stock ETF or otherwise). We all need to think for ourselves when it comes to trading our own accounts. First, it is the only way to really learn. Second, we are the only ones responsible for our decisions. Think of these charts as food for further analysis. Before making a trade, it is important to have a plan. Plan the trade and trade the plan. Among other things, this includes setting a trigger level, a target area and a stop-loss level. It is also important to plan for three possible price movements: advance, decline or sideways. Have a plan for all three scenarios BEFORE making the trade. Consider possible holding times. And finally, look at overall market conditions and sector/industry performance.


