Stocks took it on the chin last week with large-caps leading the way lower. QQQ and the S&P 100 ETF (OEF) lost around 3% last week. Big banks and big techs led the way lower as XLK and XLF lost over 3%. The Consumer Discretionary SPDR (XLY) held up relatively well with a 1.3% loss. Relative strength in consumer discretionary can be attributed to the Home Construction iShares (ITB), which gained 2.1% on the week. Big oil will be in the spotlight on Monday as XOM reports before the open.
**This chart analysis is for educational purposes only, and should not
be construed as a recommendation to buy, sell or sell-short said securities**
Short-term Overview (Monday, 2-February-2015):
- All Five AD Lines are in short-term downtrends.
- The three bond-related risk indicators remain negative.
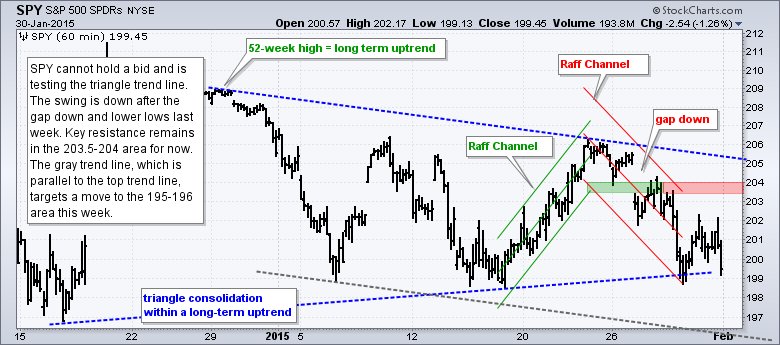
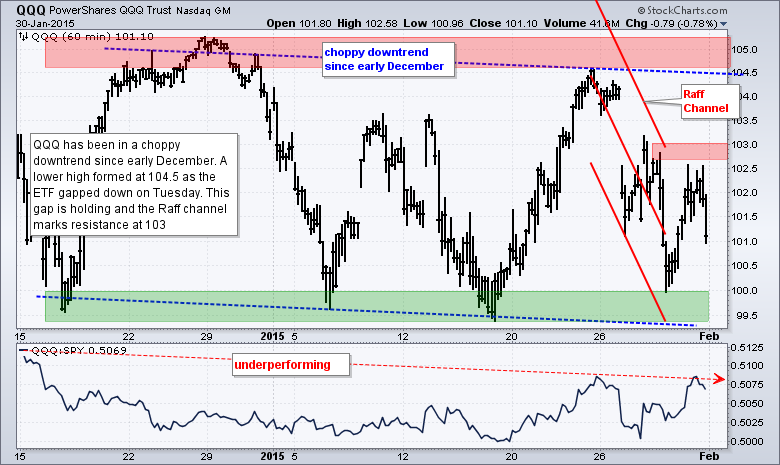
- QQQ and SPY gapped down on 27-Jan to start short-term downtrends.
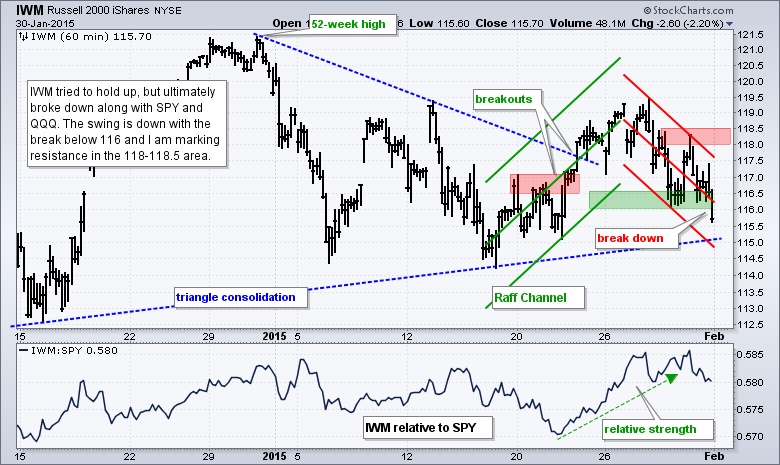
- IWM broke down on 30-Jan to start a short-term downtrend.
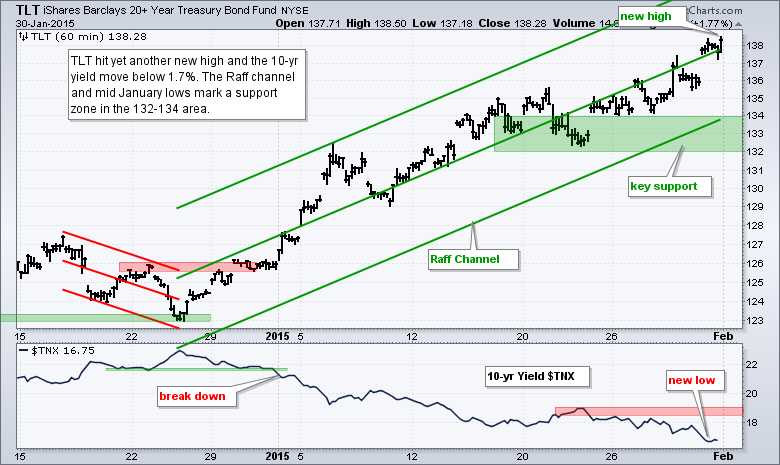
- TLT hit another new high on Friday and continues to outperform SPY.
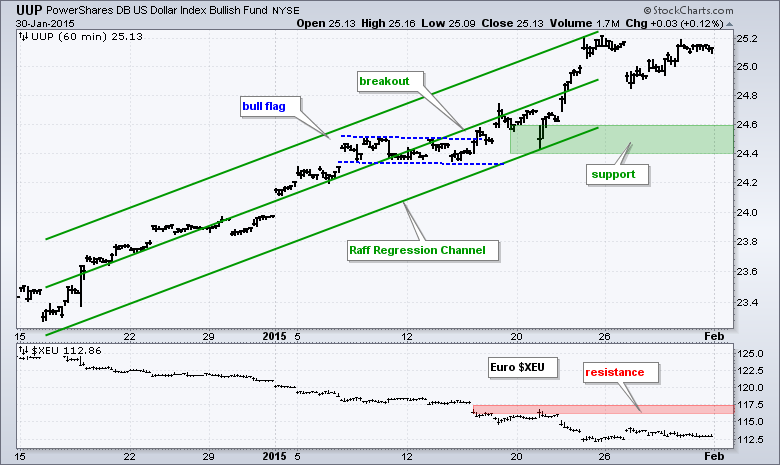
- UUP is back near its highs and in an uptrend.
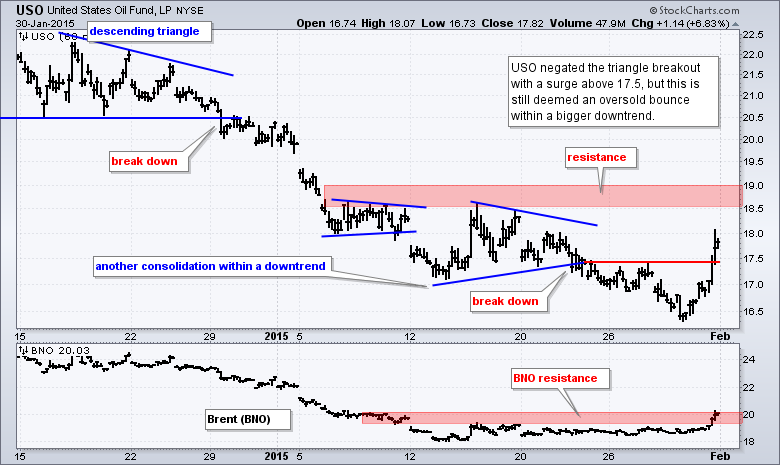
- USO got a big oversold bounce within a downtrend.
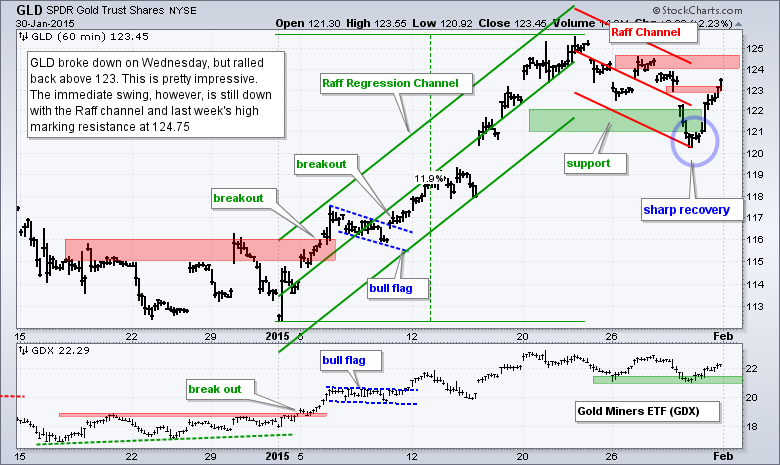
- GLD recovered after its 29-Jan support break, but the swing remains down.
The E-mini broke support with a sharp decline on Wednesday and this break held on Thursday and Friday. The E-mini remains in a triangle overall, but the swing within this triangle is clearly down. A triangle break would target further weakness towards the 1950 area.
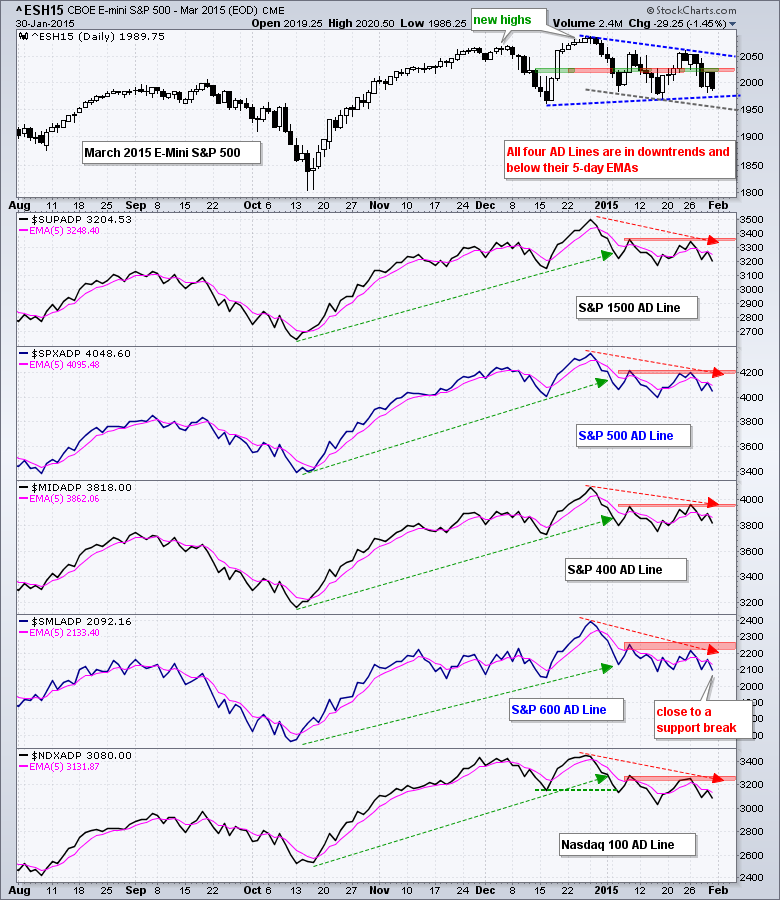
All five AD Lines are in downtrends. All five formed lower highs from late December to late January and four of the five formed lower highs from early January to late January. The S&P Small-Cap 600 AD Line is perhaps the weakest of the five because it is the closest to breaking support from the mid January low.
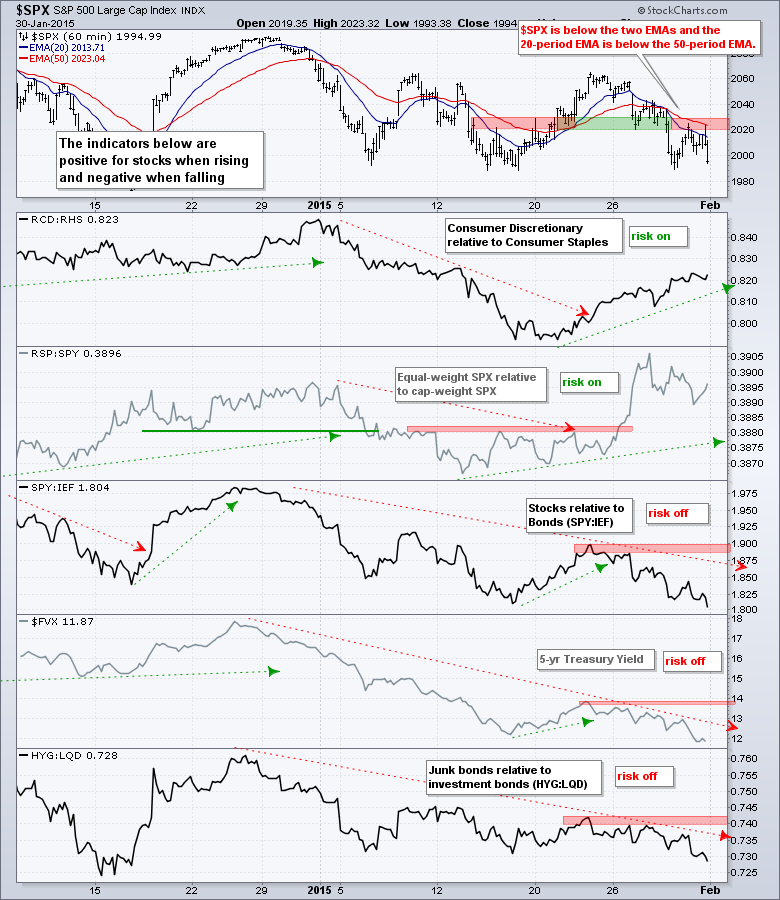
Three of the five risk indicators remain negative. The two stock-specific indicators are holding up, but the bond-related indicators hit new lows for the move. Note that SPY is underperforming the 7-10 YR T-Bond ETF (IEF), the 5-year Treasury Yield ($FVX) hit a new low for the year and the HYQ:LQD ratio ended below its mid January low (junk bonds lagging investment grade bonds). These indicators point to risk aversion in the market place right now.
The economic news and earnings reports were negative last week and the stock market reacted negatively. As noted before, a strong market would shrug off the negativity and this market did not. Stocks are falling on bad news and this is bearish, at least for the short-term. All five AD Lines are in downtrends, three of the five risk indicators are negative, SPY and QQQ held their gaps and IWM broke support on Friday. It all adds up to a bearish short-term environment as we head into a big week for economic reports.
**************************************************************
**************************************************************
**************************************************************
**************************************************************
**************************************************************
**************************************************************
***************************************************************
Key Reports and Events (all times Eastern):
Mon - Feb 02 - 08:30 - Personal Income & Spending
Mon - Feb 02 - 08:30 - PCE Prices
Mon - Feb 02 - 10:00 - ISM Manufacturing Index
Mon - Feb 02 - 10:00 - Construction Spending
Tue - Feb 03 - 10:00 - Factory Orders
Tue - Feb 03 - 14:00 - Auto-Truck Sales
Wed - Feb 04 - 07:00 - MBA Mortgage Index
Wed - Feb 04 - 08:15 - ADP Employment Report
Wed - Feb 04 - 10:00 - ISM Services Index
Wed - Feb 04 - 10:30 - Oil Inventories
Thu - Feb 05 - 07:30 - Challenger Jobs Report
Thu - Feb 05 - 08:30 - Initial Jobless Claims
Thu - Feb 05 - 10:30 - Natural Gas Inventories
Fri - Feb 06 - 08:30 - Employment Report
Tue - Feb 10 - 10:00 - JOLTS Jobs Report
Wed - Feb 11 - 07:00 - MBA Mortgage Index
Wed - Feb 11 - 10:30 - Oil Inventories
Thu - Feb 12 - 08:30 - Initial Jobless Claims
Thu - Feb 12 - 08:30 - Retail Sales
Thu - Feb 12 - 10:30 - Natural Gas Inventories
Fri - Feb 13 - 09:55 - Michigan Sentiment
Tue - Feb 17 - 08:30 - Empire Manufacturing
Tue - Feb 17 - 10:00 - NAHB Housing Market Index
Wed - Feb 18 - 07:00 - MBA Mortgage Index
Wed - Feb 18 - 08:30 - Housing Starts/Building Permits
Wed - Feb 18 - 08:30 - Producer Price Index (PPI)
Wed - Feb 18 - 09:15 - Industrial Production
Wed - Feb 18 - 14:00 - FOMC Minutes
Thu - Feb 19 - 08:30 - Initial Jobless Claims
Thu - Feb 19 - 10:00 - Philadelphia Fed
Thu - Feb 19 - 10:00 - Leading Indicators
Thu - Feb 19 - 10:30 - Natural Gas Inventories
Thu - Feb 19 - 11:00 - Oil Inventories
Mon - Feb 23 - 10:00 - Existing Home Sales
Tue - Feb 24 - 09:00 - Case-Shiller 20-city Index
Tue - Feb 24 - 10:00 - Consumer Confidence
Wed - Feb 25 - 07:00 - MBA Mortgage Index
Wed - Feb 25 - 10:00 - New Home Sales
Wed - Feb 25 - 10:30 - Oil Inventories
Thu - Feb 26 - 08:30 - Initial Jobless Claims
Thu - Feb 26 - 08:30 - Consumer Price Index (CPI)
Thu - Feb 26 - 08:30 - Durable Goods Orders
Thu - Feb 26 - 09:00 - FHFA Housing Price Index
Thu - Feb 26 - 10:30 - Natural Gas Inventories
Fri - Feb 27 - 08:30 - GDP
Fri - Feb 27 - 09:45 - Chicago PMI
Fri - Feb 27 - 09:55 - Michigan Sentiment
Fri - Feb 27 - 10:00 - Pending Home Sales
This commentary is designed to stimulate thinking. This analysis is not a recommendation to buy, sell, hold or sell short any security (stock ETF or otherwise). We all need to think for ourselves when it comes to trading our own accounts. First, it is the only way to really learn. Second, we are the only ones responsible for our decisions. Think of these charts as food for further analysis. Before making a trade, it is important to have a plan. Plan the trade and trade the plan. Among other things, this includes setting a trigger level, a target area and a stop-loss level. It is also important to plan for three possible price movements: advance, decline or sideways. Have a plan for all three scenarios BEFORE making the trade. Consider possible holding times. And finally, look at overall market conditions and sector/industry performance.


