Stocks opened weak with a sharp decline in the first 30 minutes and then traded flat the rest of the day. Even though stocks managed to firm after early weakness, buyers held back and the major index ETFs closed with modest losses. Oil got the blame again as crude fell another 3+ percent. Gold and Treasuries attracted money as safe havens. Note that both GLD and TLT broke of bull flag patterns over the last few days. In addition to precious metals, the Home Construction iShares (ITB) bucked the selling pressure and closed with a small gain. Note that I will be focusing on ITB and housing stocks in today's Webinar at 1PM ET. Elsewhere, REITs, Telecoms and Biotechs also bucked the selling pressure and closed with modest gains.
**This chart analysis is for educational purposes only, and should not
be construed as a recommendation to buy, sell or sell-short said securities**
Short-term Overview (Tuesday, 13-January-2015):
- The AD Lines turned back down over the last two days.
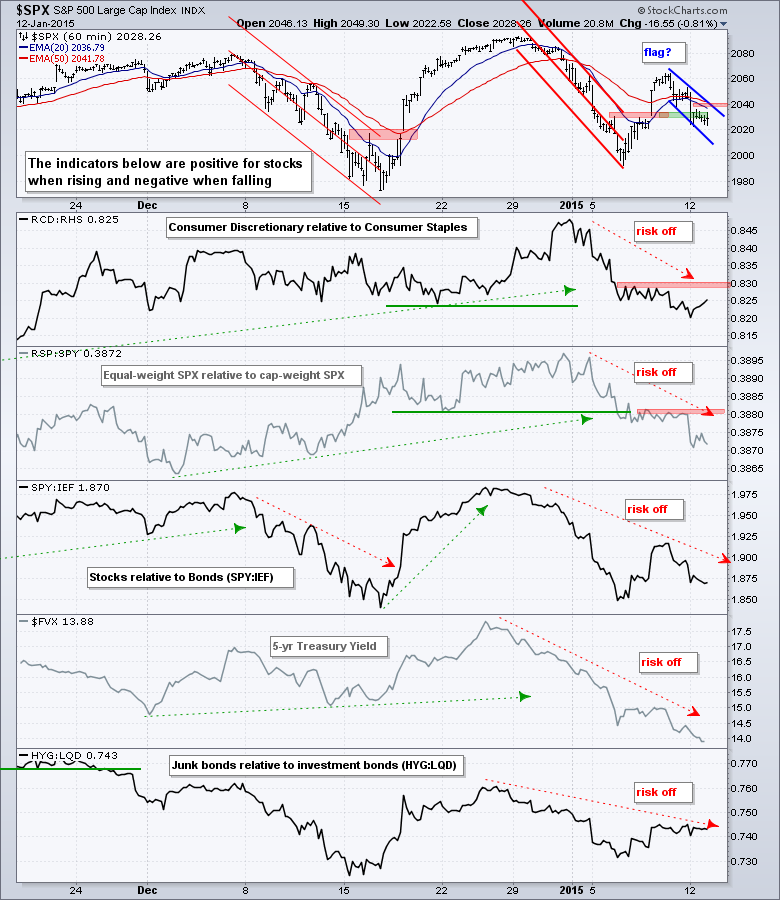
- The risk indicators remain negative overall.
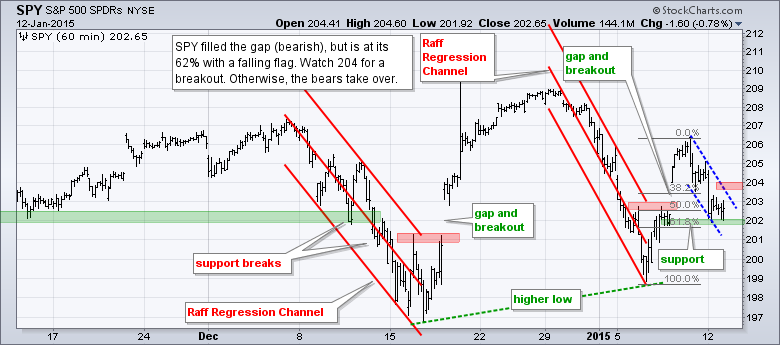
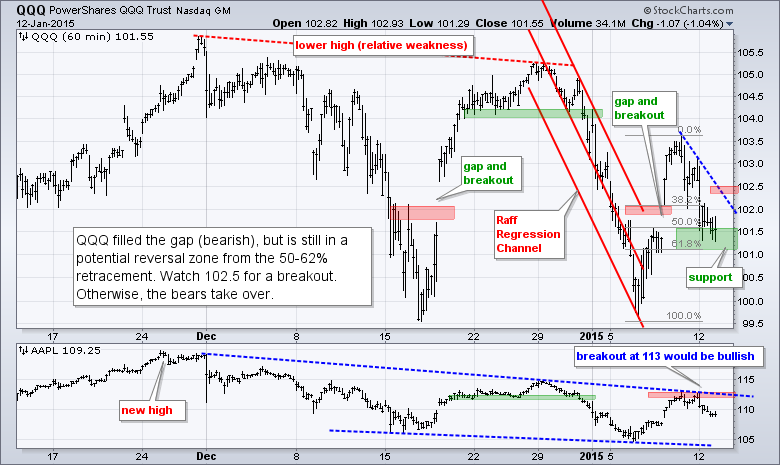
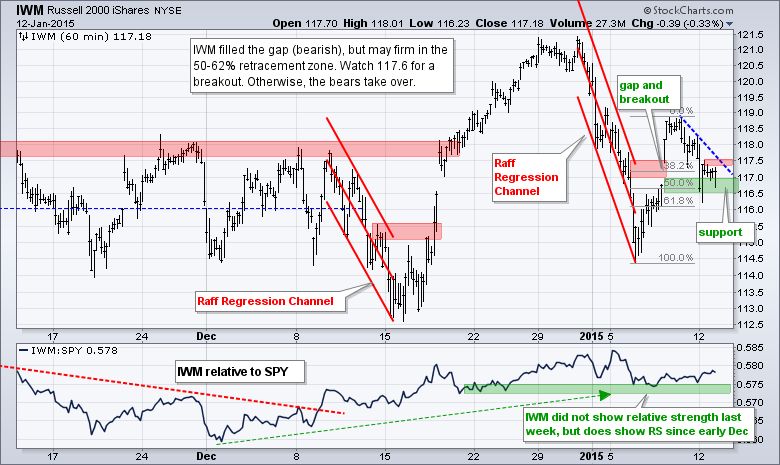
- QQQ, SPY and IWM broke out with gaps on 8-Jan and are now testing these breakouts.
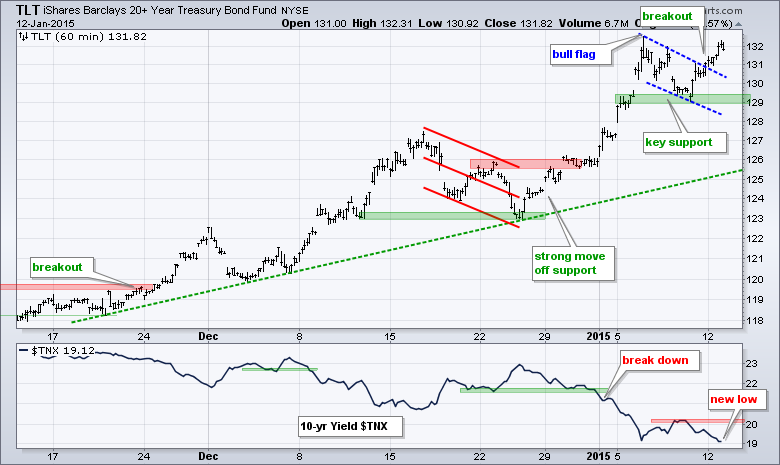
- TLT formed a small bull flag, broke the upper trend line and hit another new high.
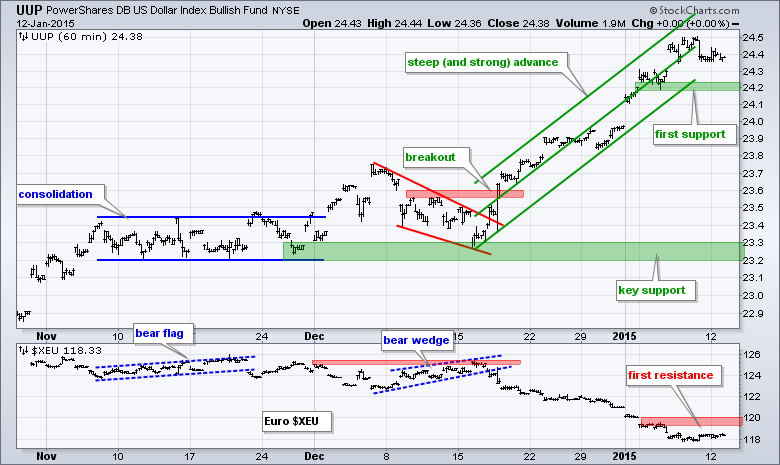
- UUP remains in a strong uptrend, but is also getting overextended and ripe for a rest.
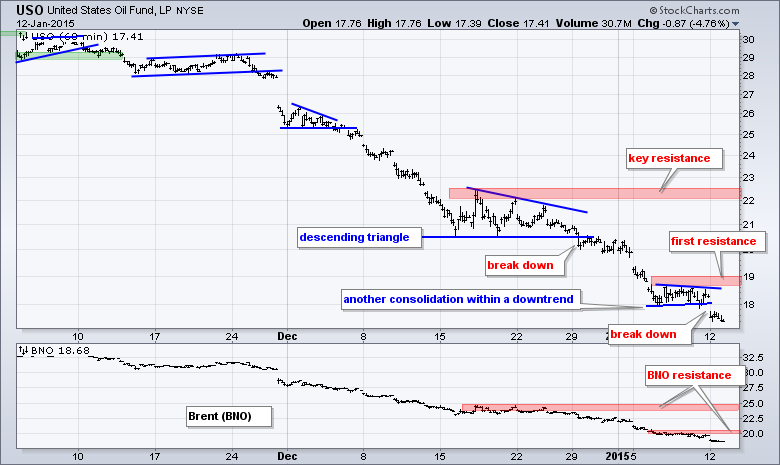
- USO formed another consolidation in its downtrend and broke down.
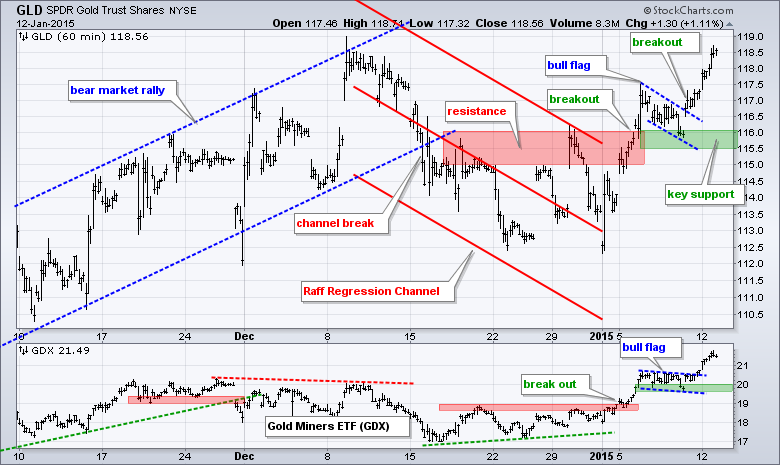
- GLD broke flag resistance and key support is set in the 115.5-116 area.
The E-mini broke out with a surge on Wednesday-Thursday, but fell back on Friday-Monday. This decline wiped out the gains from Thursday's surge and the breakout is under threat with a test of the 2020 level.
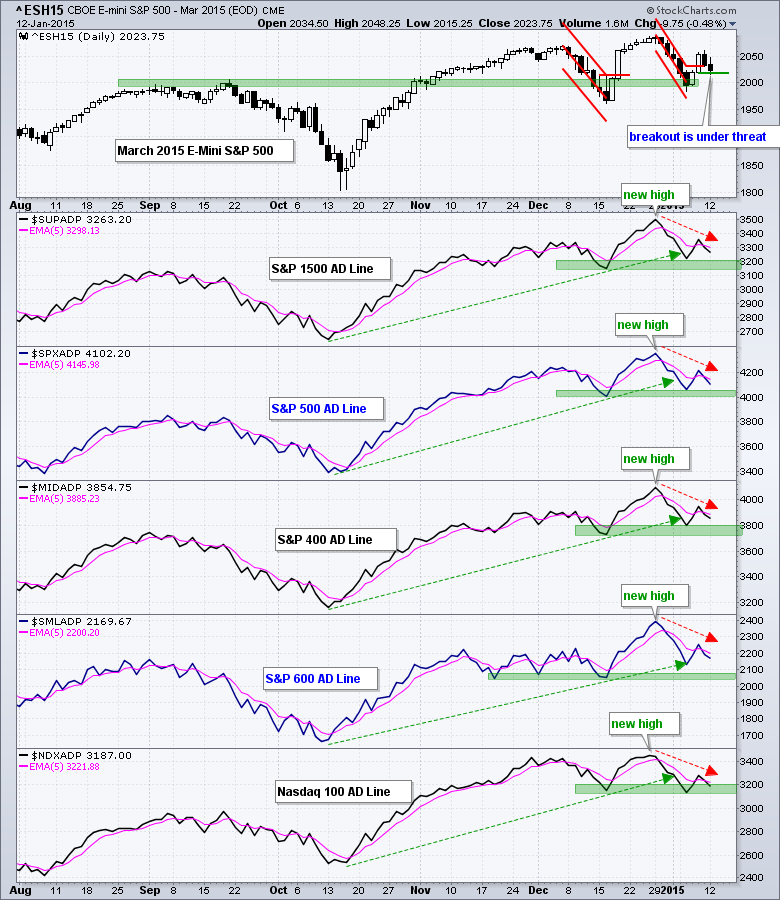
All five AD Lines hit new highs in late December and then fell back over the last three weeks. As the red arrows show, I could make the case for a three week downtrend in these indicators and all five are below their 5-day EMAs. The Nasdaq 100 AD Line remains the weakest of the five. The S&P Small-Cap 600 and S&P MidCap 400 AD Lines are holding up a little better.
The risk indicators are negative and suggest risk aversion in the market right now. Three stand out as particularly negative. First, the consumer discretionary sector is lagging the consumer staples sector. Second, the equal-weight S&P 500 is lagging the cap-weight S&P 500. This shows relative weakness in the average stock in the S&P 500. Third, the 5-year Treasury Yield ($FVX) continues its plunge as money moved into Treasury bonds. This suggests that money is seeking out a relative safe haven.
The bulk of the short-term evidence is turning negative and the major index ETFs are at their moment-of-truth. The risk indicators are clearly negative, the AD Lines have been declining for three weeks and the major index ETFs filled their gaps. SPY, QQQ and IWM are near their 50-62% retracement zones after the two day decline. This is where a normal pullback should hold. Further weakness would clearly negate last week's breakouts and put the bears in control of the short-term.
**************************************************************
**************************************************************
**************************************************************
**************************************************************
**************************************************************
**************************************************************
***************************************************************
Key Reports and Events (all times Eastern):
Tue - Jan 13 - 10:00 - JOLTS - Job Openings
Tue - Jan 13 - 14:00 - Treasury Budget
Wed - Jan 14 - 07:00 - MBA Mortgage Index
Wed - Jan 14 - 08:30 - Retail Sales
Wed - Jan 14 - 10:30 - Oil Inventories
Wed - Jan 14 - 14:00 - Fed's Beige Book
Thu - Jan 15 - 08:30 - Initial Jobless Claims
Thu - Jan 15 - 08:30 - Producer Price Index (PPI)
Thu - Jan 15 - 08:30 - Empire State Manufacturing
Thu - Jan 15 - 10:00 - Philadelphia Fed
Thu - Jan 15 - 10:30 - Natural Gas Inventories
Fri - Jan 16 - 08:30 - Consumer Price Index (CPI)
Fri - Jan 16 - 09:15 - Industrial Production
Fri - Jan 16 - 09:55 - Michigan Sentiment
This commentary is designed to stimulate thinking. This analysis is not a recommendation to buy, sell, hold or sell short any security (stock ETF or otherwise). We all need to think for ourselves when it comes to trading our own accounts. First, it is the only way to really learn. Second, we are the only ones responsible for our decisions. Think of these charts as food for further analysis. Before making a trade, it is important to have a plan. Plan the trade and trade the plan. Among other things, this includes setting a trigger level, a target area and a stop-loss level. It is also important to plan for three possible price movements: advance, decline or sideways. Have a plan for all three scenarios BEFORE making the trade. Consider possible holding times. And finally, look at overall market conditions and sector/industry performance.
