It was a pretty wild week as stocks plunged Monday-Tuesday, surged Wednesday-Thursday and fell back on Friday. After all the pushing and shoving, the major index ETFs ended with small losses for the week. Well, IWM lost 1.14%, which is a modest loss. Energy, industrials and finance weighed on the broader market. Healthcare and consumer staples carried the torch for the bulls. The HealthCare SPDR (XLV) was one of the strongest sectors in 2014 and is the strongest sector so far in 2015. Energy was the weakest sector in 2014 and is the weakest sector so far in 2015. The more things change the more they stay the same. Overall, the market is pretty mixed, but I think the bulls still have an edge over the bears. Elsewhere, I am concerned with banks and the Regional Bank SPDR (KRE), but see signs of life in the Home Construction iShares (ITB).
**This chart analysis is for educational purposes only, and should not
be construed as a recommendation to buy, sell or sell-short said securities**
Short-term Overview (Monday, 12-January-2015):
- Four of five AD Lines held above their mid December lows and bounced.
- The risk indicators remain negative overall.
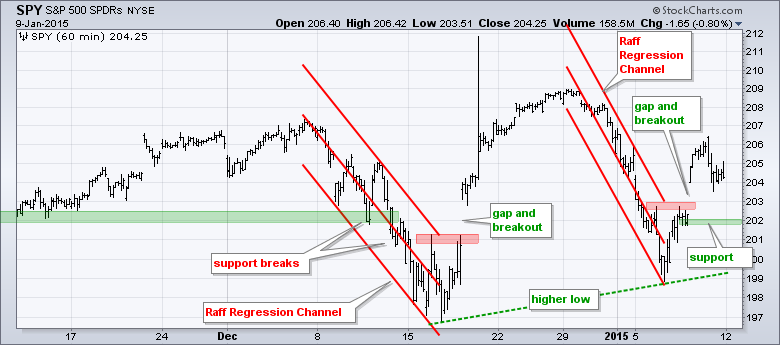
- SPY broke out with a gap on 8-Jan and support is set at 202.
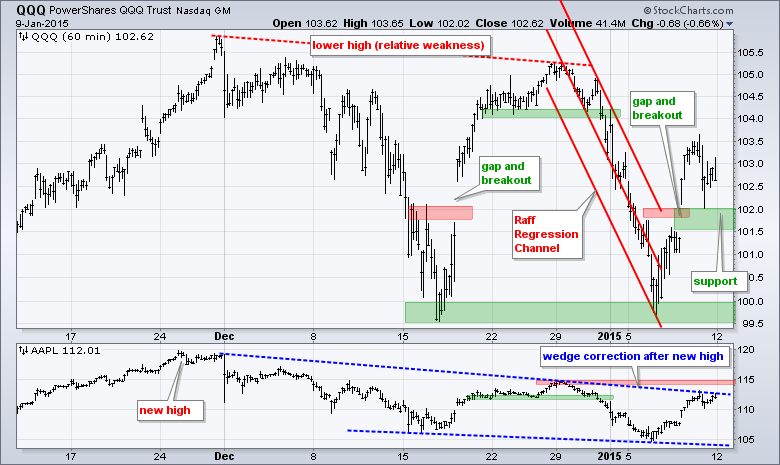
- QQQ broke out with a gap on 8-Jan and support is set at 101.5.
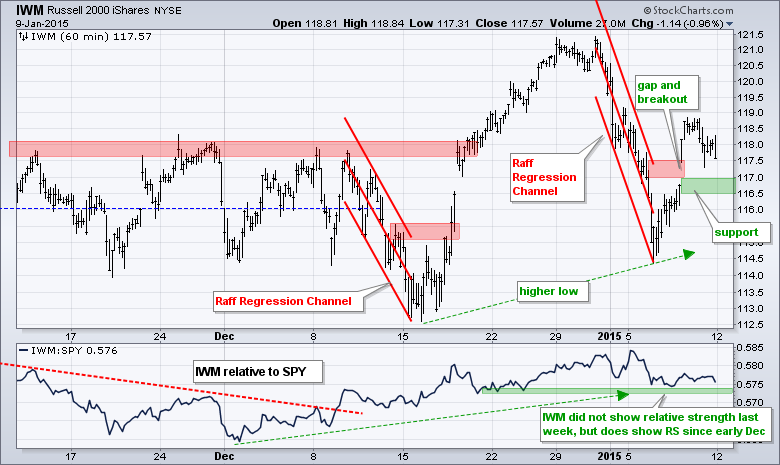
- IWM broke out with a gap on 8-Jan and support is set at 116.50
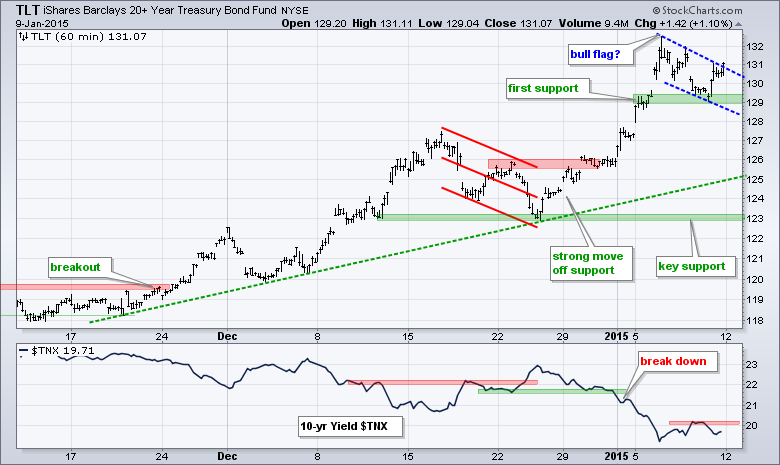
- TLT formed a small bull flag and broke the upper trend line.
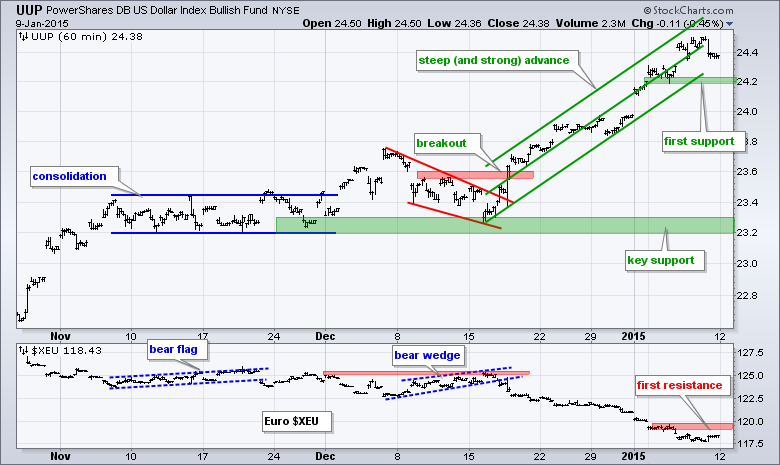
- UUP remains in a strong uptrend, but is also getting overextended and ripe for a rest.
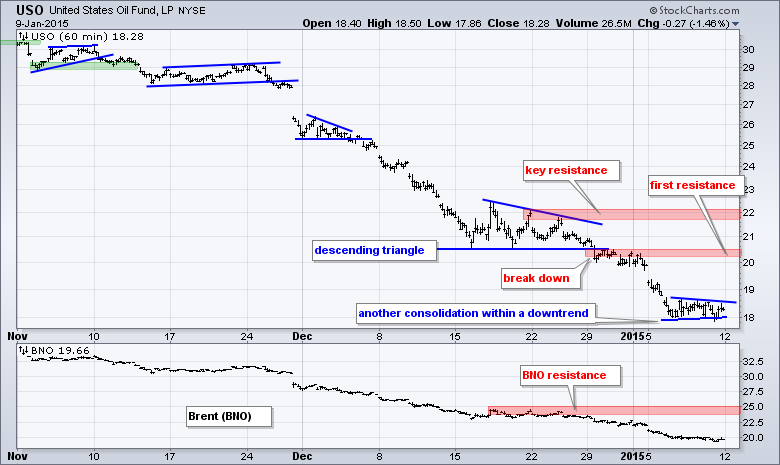
- USO formed another consolidation within its strong downtrend.
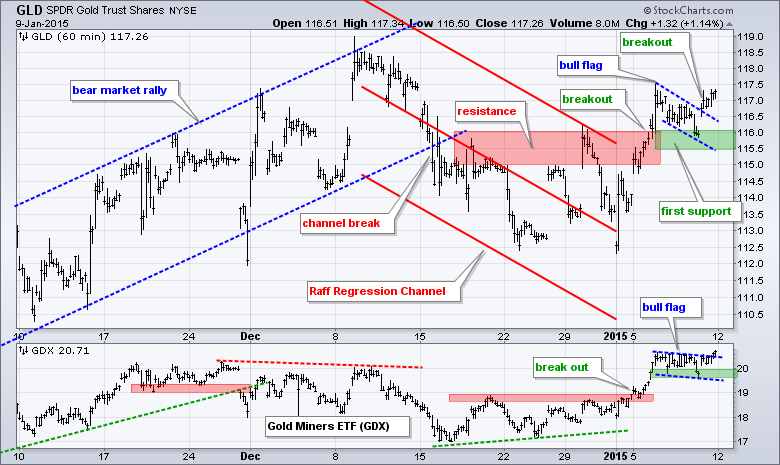
- GLD broke flag resistance and key support is set in the 115.5-116 area.
The E-mini broke out on Thursday with a move above the upper trend line of the Raff Regression Channel and then fell back to the breakout on Friday. A little pullback is fine and the breakout is still alive. Further weakness below Thursday's low would, however, negate the breakout.
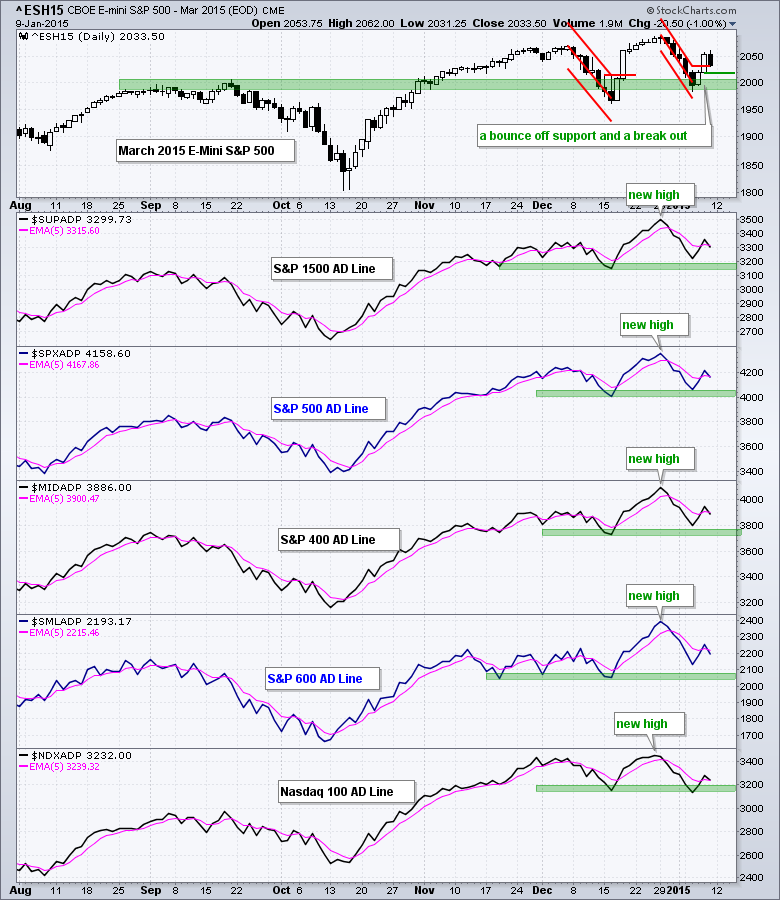
All five AD Lines surged on Wednesday-Thursday and fell back on Friday. The overall trends are up because all five hit new highs in late December. At this point, I am not getting any added info from the breadth indicators and am most focused on the price action in the underlying ETFs. The Nasdaq 100 AD Line is the weakest of the five because it pierced its mid December low last week.
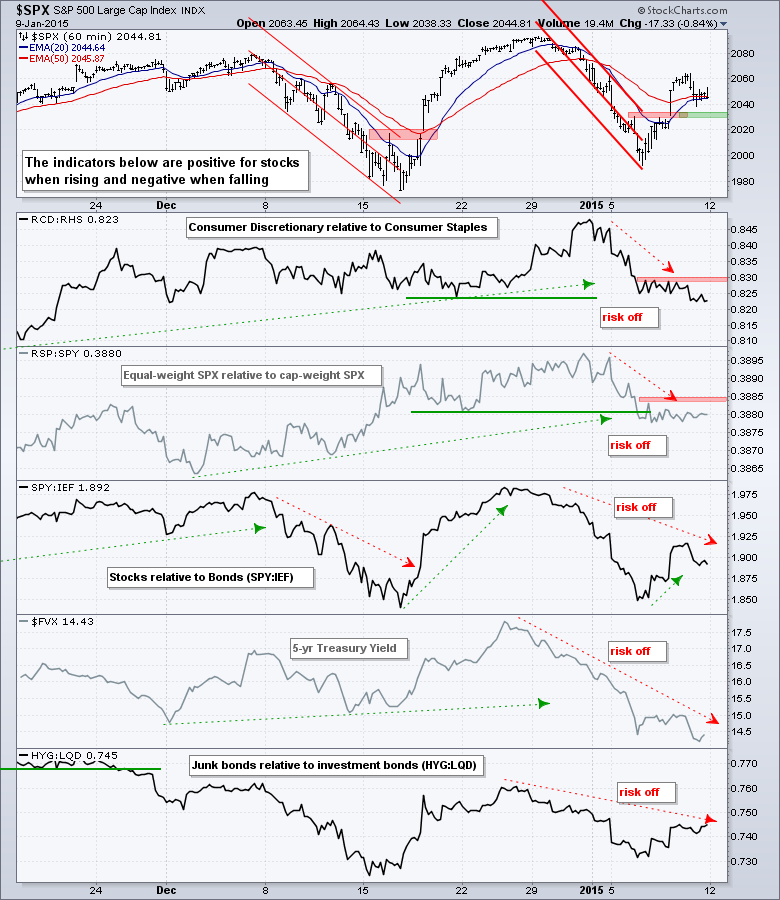
The risk indicators remain more negative than positive. The consumer discretionary sector continues to underperform the consumer staples sector in 2015 and the equal-weight S&P 500 is lagging behind the cap-weight S&P 500. Also notice that the 5-year Treasury Yield ($FVX) sank to a new low for the move. Again, money moved into short-term Treasuries and there is clearly some risk-aversion out there right now.
At this point, the bulk of the short-term evidence is mixed. The risk indicators are negative, but price action, which is the most important factor, is bullish. SPY, QQQ and IWM broke above the upper lines of the Raff Regression Channels. There were big gaps on Thursday and pullbacks on Friday. It is important that these gaps hold because a move below the gap zones would suggest that the bulls are getting cold feet.
**************************************************************
**************************************************************
**************************************************************
**************************************************************
**************************************************************
**************************************************************
***************************************************************
Key Reports and Events (all times Eastern):
Tue - Jan 13 - 10:00 - JOLTS - Job Openings
Tue - Jan 13 - 14:00 - Treasury Budget
Wed - Jan 14 - 07:00 - MBA Mortgage Index
Wed - Jan 14 - 08:30 - Retail Sales
Wed - Jan 14 - 10:30 - Oil Inventories
Wed - Jan 14 - 14:00 - Fed's Beige Book
Thu - Jan 15 - 08:30 - Initial Jobless Claims
Thu - Jan 15 - 08:30 - Producer Price Index (PPI)
Thu - Jan 15 - 08:30 - Empire State Manufacturing
Thu - Jan 15 - 10:00 - Philadelphia Fed
Thu - Jan 15 - 10:30 - Natural Gas Inventories
Fri - Jan 16 - 08:30 - Consumer Price Index (CPI)
Fri - Jan 16 - 09:15 - Industrial Production
Fri - Jan 16 - 09:55 - Michigan Sentiment
This commentary is designed to stimulate thinking. This analysis is not a recommendation to buy, sell, hold or sell short any security (stock ETF or otherwise). We all need to think for ourselves when it comes to trading our own accounts. First, it is the only way to really learn. Second, we are the only ones responsible for our decisions. Think of these charts as food for further analysis. Before making a trade, it is important to have a plan. Plan the trade and trade the plan. Among other things, this includes setting a trigger level, a target area and a stop-loss level. It is also important to plan for three possible price movements: advance, decline or sideways. Have a plan for all three scenarios BEFORE making the trade. Consider possible holding times. And finally, look at overall market conditions and sector/industry performance.


