After a surge from 1985 to 2050, trading in the S&P 500 turned choppy on Wednesday with a rather tight range. There was, however, some late selling pressure as the index dropped from 2053 to 2040 in the final 30 minutes. Must have been some news event hitting the tape. Regardless, the index is holding the majority of this week's gains. Sector leadership is also a positive force. The Consumer Discretionary SPDR (XLY) led the sector SPDRs and the SmallCap Consumer Discretionary ETF (PSCD) led the small-caps sector ETFs. The Home Construction iShares (ITB) surged over 1.5% and the Retail SPDR (XRT) managed a small gain. Energy stocks were slammed as oil fell sharply. Keep in mind that oil and energy stocks are in long-term downtrends. There will be oversold bounces and counter-trend rallies along the way, but there are no signs yet of lasting bottom (base).
**This chart analysis is for educational purposes only, and should not
be construed as a recommendation to buy, sell or sell-short said securities**
Short-term Overview (Thursday, 5-February-2015):
- Short-term breadth surged for a bullish signal on 21-Jan.
- The three bond-related indicators are risk negative, but the two stock indicators are risk positive.
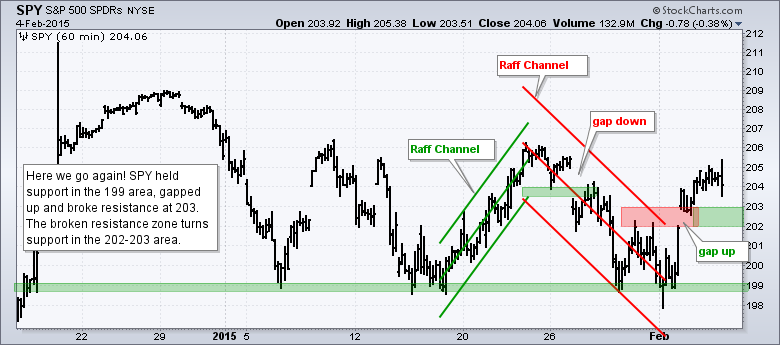
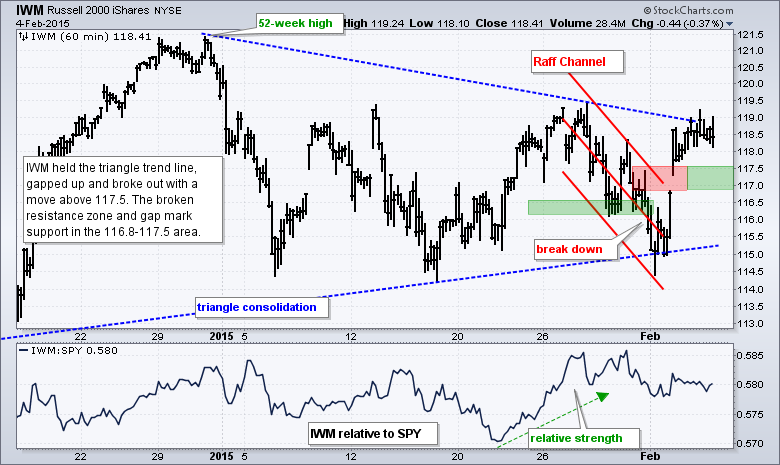
- SPY and IWM broke out with gaps and strong moves on 3-Feb.
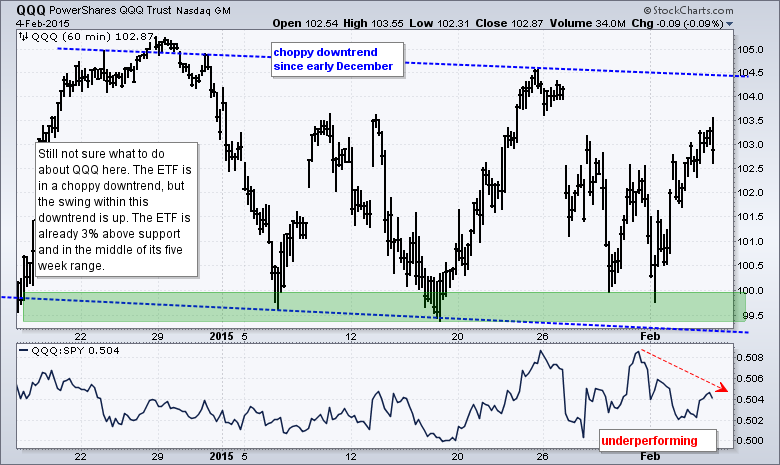
- QQQ is in an upswing, but within a choppy range since December.
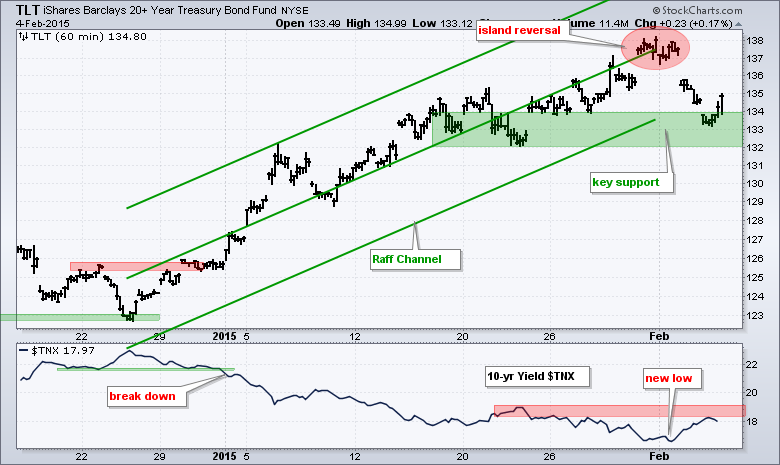
- TLT formed an island reversal over the last few days, but the bigger trend remains up and the ETF is near support.
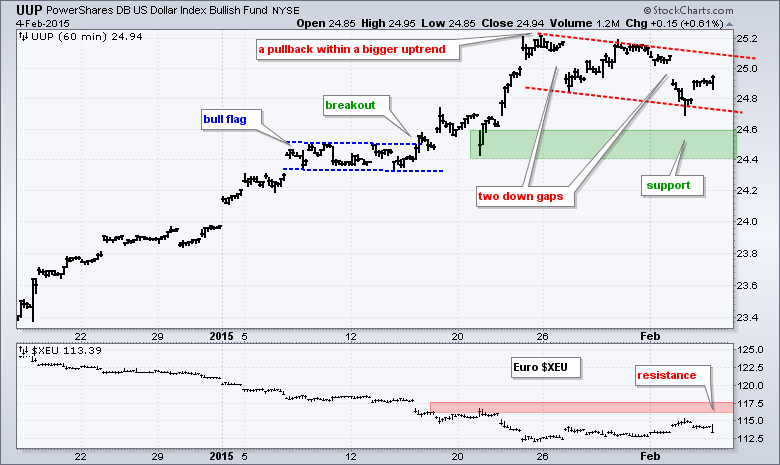
- UUP fell over the last two weeks, but this looks like a pullback within a bigger uptrend.
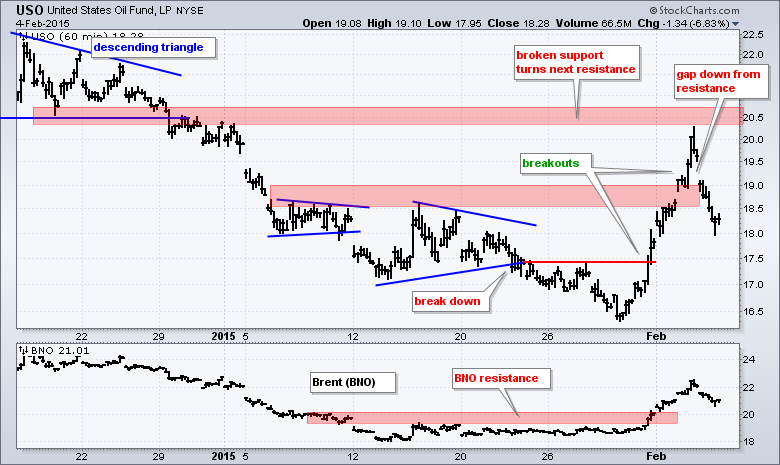
- USO reversed near the December lows (broken support) with a gap down and sharp decline.
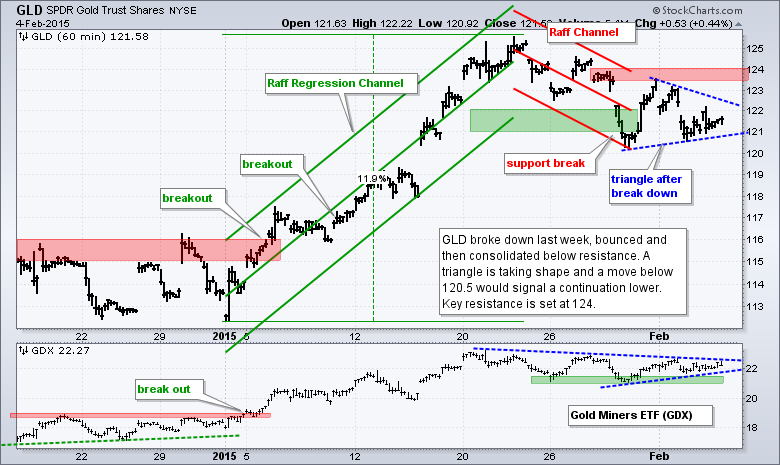
- GLD broke down on 29-Jan and is consolidating within a short-term downtrend.
The E-mini bounced off the 2000 area Monday-Tuesday and fell back on Wednesday. The bulk of the bounce is holding for now. Overall, the E-mini remains in a tight range over the last four weeks (2060-1965).
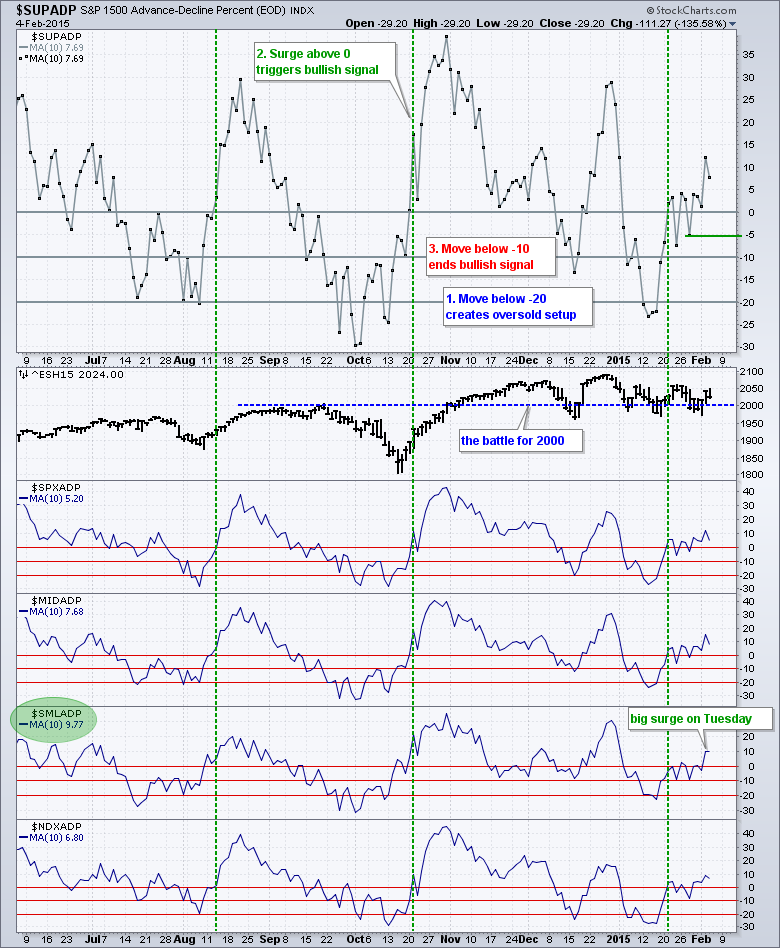
After a big surge on Tuesday, the breadth indicators fell back on Wednesday. The decline was quite modest and not enough to undo the breadth thrust of the last five days. Note that S&P SmallCap AD Percent ($SMLADP) is the strongest because the 10-day SMA is the highest of the four (9.77%). Overall, I would become concerned if the 10-day SMA for S&P 1500 AD Percent ($SUPADP) moves below -6% (last week's low). A bull signal triggered with the first surge above zero on January 21st. There are three steps to this system. A move below -20% creates an oversold condition, which is the setup. A subsequent move above 0 signals a momentum up-thrust, which is the signal. This signal remains valid until a cross below -10%. I am, however, tightening this to -6% because of choppy trading.
The two stock-specific risk indicators are positive for stocks. The consumer discretionary sector continues to outperform the consumer staples sector and the equal-weight S&P 500 continues to outperform the cap-weight S&P 500. The three bond-related indicators remain negative and have been since late December. Stocks are underperforming bonds, the 5-year Treasury Yield ($FVX) is in a downtrend and junk bonds are underperforming investment grade bonds.
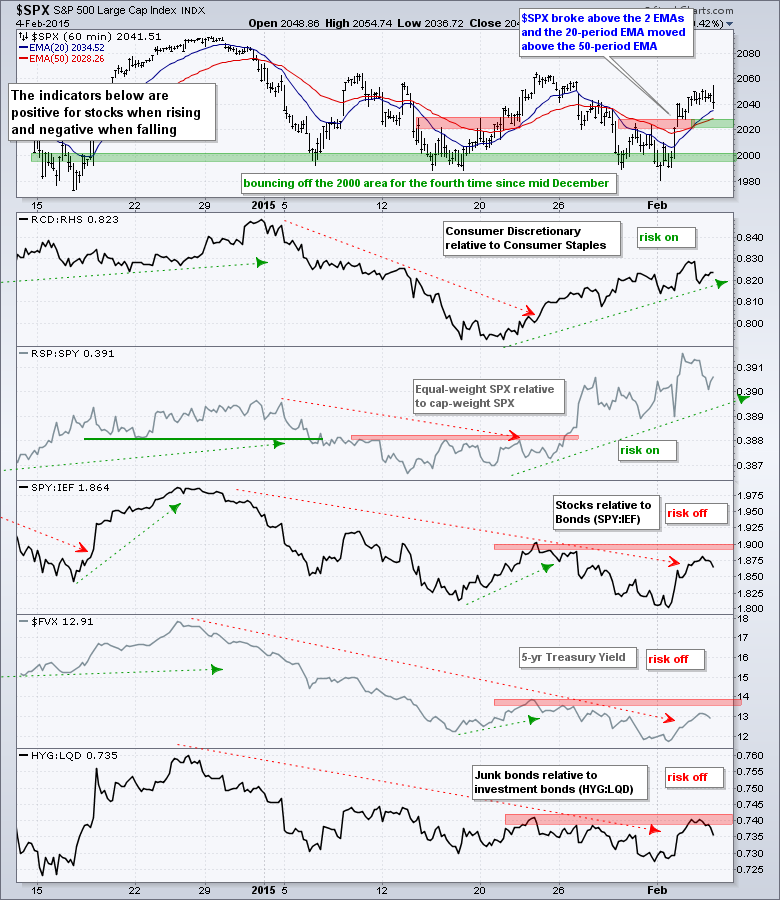
The short-term evidence is currently bullish. Breadth triggered a bullish signal on 21-Jan and has yet to negate this signal. Even though the three bond-related risk indicators are negative, the two stock-related indicators are positive and more correlated with the stock market. SPY and IWM broke out with gaps and strong moves on Tuesday. These breakouts are holding for now and I am marking support near broken resistance. A failed breakout would suggest underlying weakness or a return to choppy trading.
**************************************************************
**************************************************************
**************************************************************
**************************************************************
**************************************************************
**************************************************************
***************************************************************
Key Reports and Events (all times Eastern):
Thu - Feb 05 - 07:30 - Challenger Jobs Report
Thu - Feb 05 - 08:30 - Initial Jobless Claims
Thu - Feb 05 - 10:30 - Natural Gas Inventories
Fri - Feb 06 - 08:30 - Employment Report
Tue - Feb 10 - 10:00 - JOLTS Jobs Report
Wed - Feb 11 - 07:00 - MBA Mortgage Index
Wed - Feb 11 - 10:30 - Oil Inventories
Thu - Feb 12 - 08:30 - Initial Jobless Claims
Thu - Feb 12 - 08:30 - Retail Sales
Thu - Feb 12 - 10:30 - Natural Gas Inventories
Fri - Feb 13 - 09:55 - Michigan Sentiment
Tue - Feb 17 - 08:30 - Empire Manufacturing
Tue - Feb 17 - 10:00 - NAHB Housing Market Index
Wed - Feb 18 - 07:00 - MBA Mortgage Index
Wed - Feb 18 - 08:30 - Housing Starts/Building Permits
Wed - Feb 18 - 08:30 - Producer Price Index (PPI)
Wed - Feb 18 - 09:15 - Industrial Production
Wed - Feb 18 - 14:00 - FOMC Minutes
Thu - Feb 19 - 08:30 - Initial Jobless Claims
Thu - Feb 19 - 10:00 - Philadelphia Fed
Thu - Feb 19 - 10:00 - Leading Indicators
Thu - Feb 19 - 10:30 - Natural Gas Inventories
Thu - Feb 19 - 11:00 - Oil Inventories
Mon - Feb 23 - 10:00 - Existing Home Sales
Tue - Feb 24 - 09:00 - Case-Shiller 20-city Index
Tue - Feb 24 - 10:00 - Consumer Confidence
Wed - Feb 25 - 07:00 - MBA Mortgage Index
Wed - Feb 25 - 10:00 - New Home Sales
Wed - Feb 25 - 10:30 - Oil Inventories
Thu - Feb 26 - 08:30 - Initial Jobless Claims
Thu - Feb 26 - 08:30 - Consumer Price Index (CPI)
Thu - Feb 26 - 08:30 - Durable Goods Orders
Thu - Feb 26 - 09:00 - FHFA Housing Price Index
Thu - Feb 26 - 10:30 - Natural Gas Inventories
Fri - Feb 27 - 08:30 - GDP
Fri - Feb 27 - 09:45 - Chicago PMI
Fri - Feb 27 - 09:55 - Michigan Sentiment
Fri - Feb 27 - 10:00 - Pending Home Sales
This commentary is designed to stimulate thinking. This analysis is not a recommendation to buy, sell, hold or sell short any security (stock ETF or otherwise). We all need to think for ourselves when it comes to trading our own accounts. First, it is the only way to really learn. Second, we are the only ones responsible for our decisions. Think of these charts as food for further analysis. Before making a trade, it is important to have a plan. Plan the trade and trade the plan. Among other things, this includes setting a trigger level, a target area and a stop-loss level. It is also important to plan for three possible price movements: advance, decline or sideways. Have a plan for all three scenarios BEFORE making the trade. Consider possible holding times. And finally, look at overall market conditions and sector/industry performance.


