Stocks started strong with a surge on the open, traded flat for a few hours and then moved higher the entire afternoon. The ability to open strong and finish strong is positive and the S&P 500 finished strong the last two days. Energy led the way as oil got an oversold bounce. Note, however, that consumer discretionary also showed some relative strength and strength here bodes well for the overall market and the economic outlook. Banks also extended their rebound as the fallout from low oil prices abated with the surge in oil this week.
**This chart analysis is for educational purposes only, and should not
be construed as a recommendation to buy, sell or sell-short said securities**
Short-term Overview (Wednesday, 4-February-2015):
- Short-term breadth surged for a bullish signal.
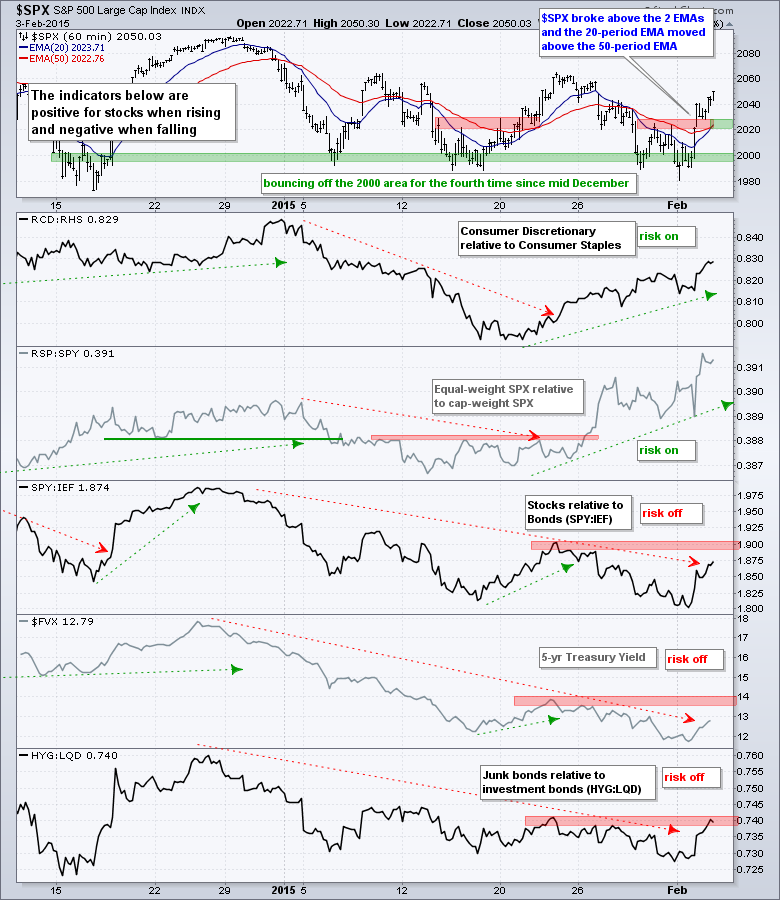
- The three bond-related risk indicators remain negative, but junk bond performance is improving.
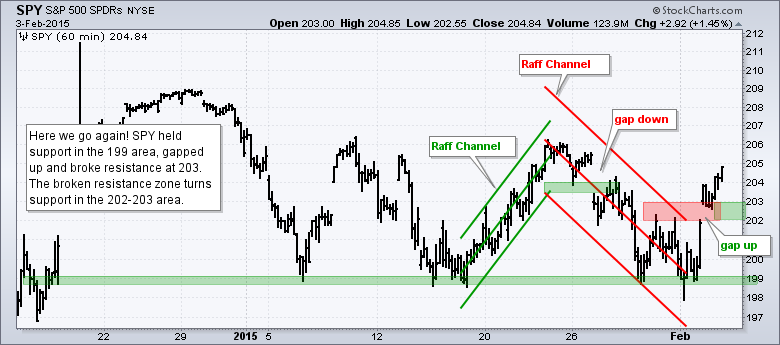
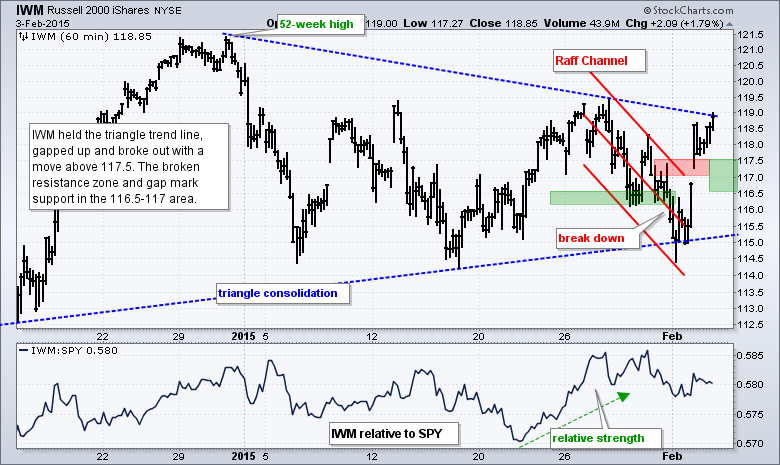
- SPY and IWM broke out with gaps and strong moves.
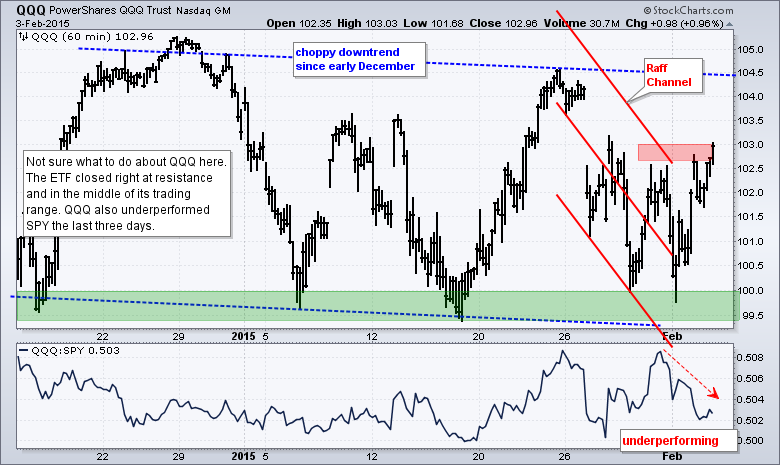
- QQQ surged, but ended at resistance and shows relative weakness.
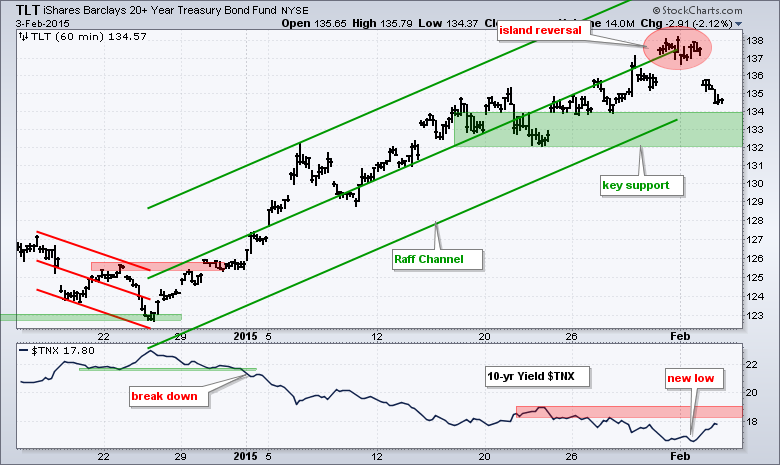
- TLT formed an island reversal over the last few days, but the bigger trend remains up.
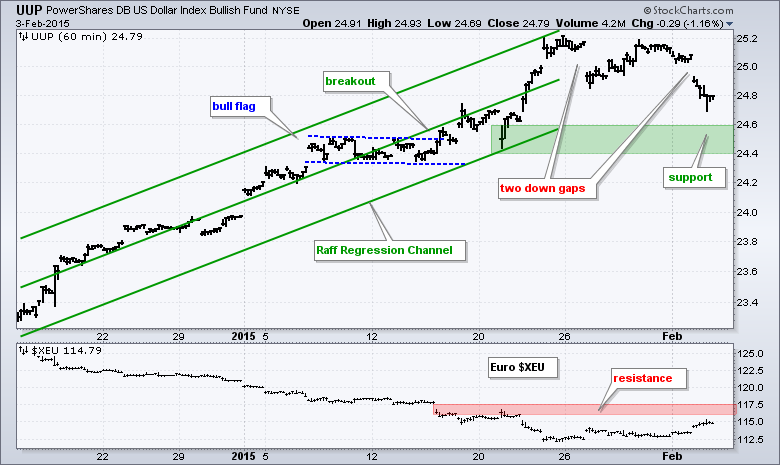
- UUP gapped down twice in the last two weeks, but the bigger trend remains up.
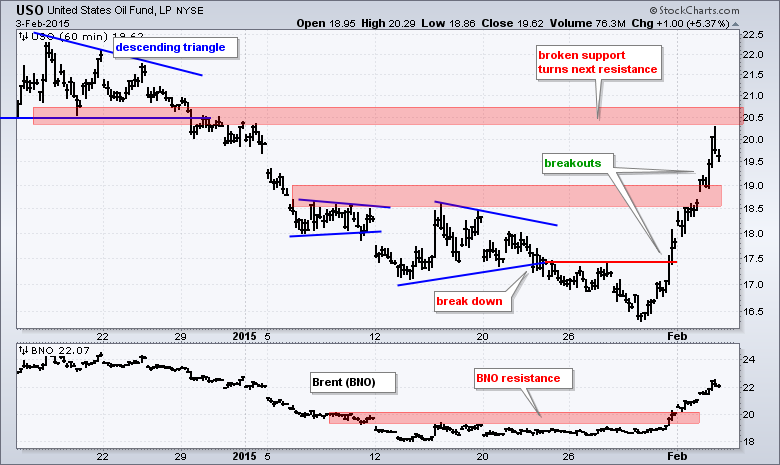
- USO extended its oversold bounce and the December consolidation marks the next resistance zone.
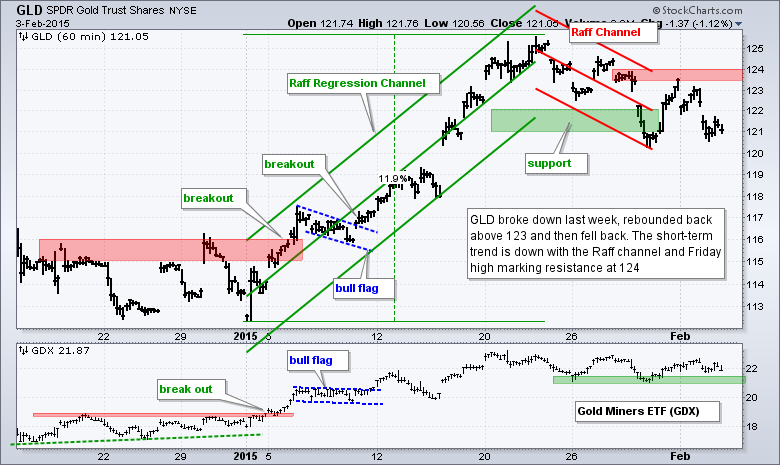
- GLD fell back and remains in a downtrend with resistance at 124.
We have a different chart today with the E-mini in the middle. The E-mini surged off support in the 2000 area for the fourth time since mid December. The mid December surge resulted in a new high, but the two prior surges fizzled just above 2050. Will the third time be the charm?
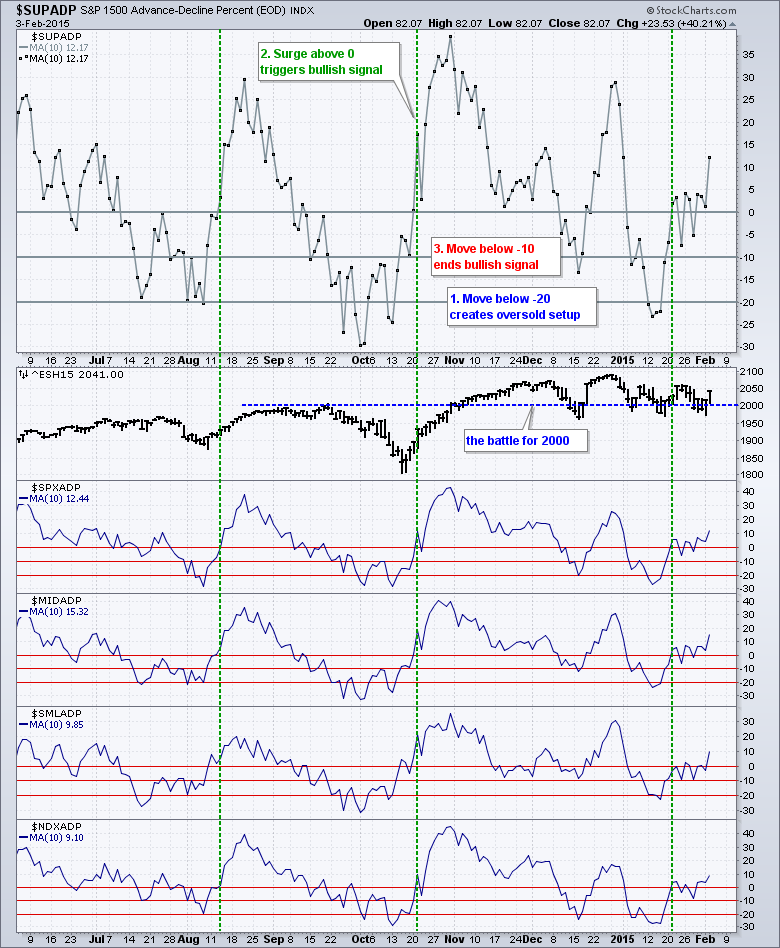
For breadth, I am showing the 10-day SMA for AD Percent with three horizontal lines (0, -10%, -20%). The main window shows the 10-day SMA for S&P 1500 AD Percent ($SUPADP), which represents the stock market as a whole. A move below -20% creates an oversold condition, which is the setup. A subsequent move above 0 signals a momentum up-thrust, which is the signal. This signal remains valid until a cross below -10%. This system triggered a bullish signal on January 21st and remains bullish until a move below -10%. Given the choppy state of the market, I would even be inclined to tighten this to -5% or perhaps even zero. In other words, a big down day in breadth would be enough to abandon this bullish signal.
So here we are again. Stocks surged with SPY and IWM getting breakouts. Breadth was strong on Tuesday with small-caps and mid-caps leading the way. The High-Yield Bond ETF (HYG) even broke above its December high with a nice gain this week. Thus, the short-term evidence is back with the bulls as the S&P 500 surges off the 2000 area for the fourth time in two months. It is important that the breakout zones in IWM and SPY hold. A strong breakout should hold and there should be no looking back. A move back below these breakout zones would suggest cold feet among the bulls.
**************************************************************
**************************************************************
**************************************************************
**************************************************************
**************************************************************
**************************************************************
***************************************************************
Key Reports and Events (all times Eastern):
Wed - Feb 04 - 07:00 - MBA Mortgage Index
Wed - Feb 04 - 08:15 - ADP Employment Report
Wed - Feb 04 - 10:00 - ISM Services Index
Wed - Feb 04 - 10:30 - Oil Inventories
Thu - Feb 05 - 07:30 - Challenger Jobs Report
Thu - Feb 05 - 08:30 - Initial Jobless Claims
Thu - Feb 05 - 10:30 - Natural Gas Inventories
Fri - Feb 06 - 08:30 - Employment Report
Tue - Feb 10 - 10:00 - JOLTS Jobs Report
Wed - Feb 11 - 07:00 - MBA Mortgage Index
Wed - Feb 11 - 10:30 - Oil Inventories
Thu - Feb 12 - 08:30 - Initial Jobless Claims
Thu - Feb 12 - 08:30 - Retail Sales
Thu - Feb 12 - 10:30 - Natural Gas Inventories
Fri - Feb 13 - 09:55 - Michigan Sentiment
Tue - Feb 17 - 08:30 - Empire Manufacturing
Tue - Feb 17 - 10:00 - NAHB Housing Market Index
Wed - Feb 18 - 07:00 - MBA Mortgage Index
Wed - Feb 18 - 08:30 - Housing Starts/Building Permits
Wed - Feb 18 - 08:30 - Producer Price Index (PPI)
Wed - Feb 18 - 09:15 - Industrial Production
Wed - Feb 18 - 14:00 - FOMC Minutes
Thu - Feb 19 - 08:30 - Initial Jobless Claims
Thu - Feb 19 - 10:00 - Philadelphia Fed
Thu - Feb 19 - 10:00 - Leading Indicators
Thu - Feb 19 - 10:30 - Natural Gas Inventories
Thu - Feb 19 - 11:00 - Oil Inventories
Mon - Feb 23 - 10:00 - Existing Home Sales
Tue - Feb 24 - 09:00 - Case-Shiller 20-city Index
Tue - Feb 24 - 10:00 - Consumer Confidence
Wed - Feb 25 - 07:00 - MBA Mortgage Index
Wed - Feb 25 - 10:00 - New Home Sales
Wed - Feb 25 - 10:30 - Oil Inventories
Thu - Feb 26 - 08:30 - Initial Jobless Claims
Thu - Feb 26 - 08:30 - Consumer Price Index (CPI)
Thu - Feb 26 - 08:30 - Durable Goods Orders
Thu - Feb 26 - 09:00 - FHFA Housing Price Index
Thu - Feb 26 - 10:30 - Natural Gas Inventories
Fri - Feb 27 - 08:30 - GDP
Fri - Feb 27 - 09:45 - Chicago PMI
Fri - Feb 27 - 09:55 - Michigan Sentiment
Fri - Feb 27 - 10:00 - Pending Home Sales
This commentary is designed to stimulate thinking. This analysis is not a recommendation to buy, sell, hold or sell short any security (stock ETF or otherwise). We all need to think for ourselves when it comes to trading our own accounts. First, it is the only way to really learn. Second, we are the only ones responsible for our decisions. Think of these charts as food for further analysis. Before making a trade, it is important to have a plan. Plan the trade and trade the plan. Among other things, this includes setting a trigger level, a target area and a stop-loss level. It is also important to plan for three possible price movements: advance, decline or sideways. Have a plan for all three scenarios BEFORE making the trade. Consider possible holding times. And finally, look at overall market conditions and sector/industry performance.


