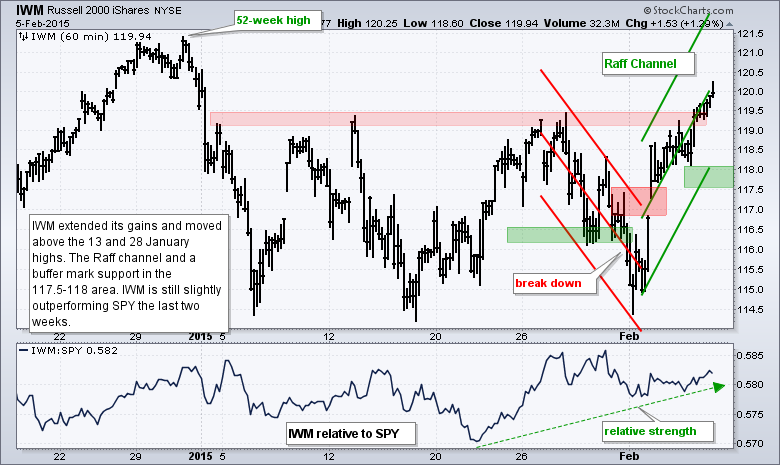
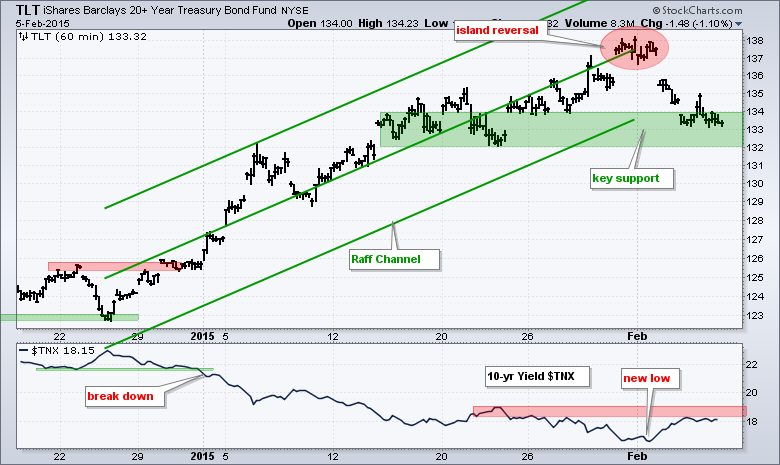
The S&P 500 surged late Monday and early Tuesday with a move from 1990 to 2040, and then worked its way higher. This is positive price action because the index held the surge and continued higher. Small-caps led the way on Thursday with IWM gaining 1.29%. All sector SPDRs were up with the Materials SPDR (XLB) leading the way (+2.42%). Autos were strong with the Global Auto ETF (CARZ) gaining over 1%. Banks continued their rebound with the Regional Bank SPDR (KRE) surging over 2%. Overall, it has been a strong week for stocks so far and today we get the employment report. Note that the 20+ YR T-Bond ETF (TLT) formed an island reversal earlier this week and this could foreshadow a strong employment number. Regardless of today's number, the trend in non-farm payrolls is up and the trend in jobless claims is down. These two trends support a long-term uptrend in stocks.
**This chart analysis is for educational purposes only, and should not
be construed as a recommendation to buy, sell or sell-short said securities**
Short-term Overview (Friday, 6-February-2015):
- Short-term breadth surged for a bullish signal on 21-Jan.
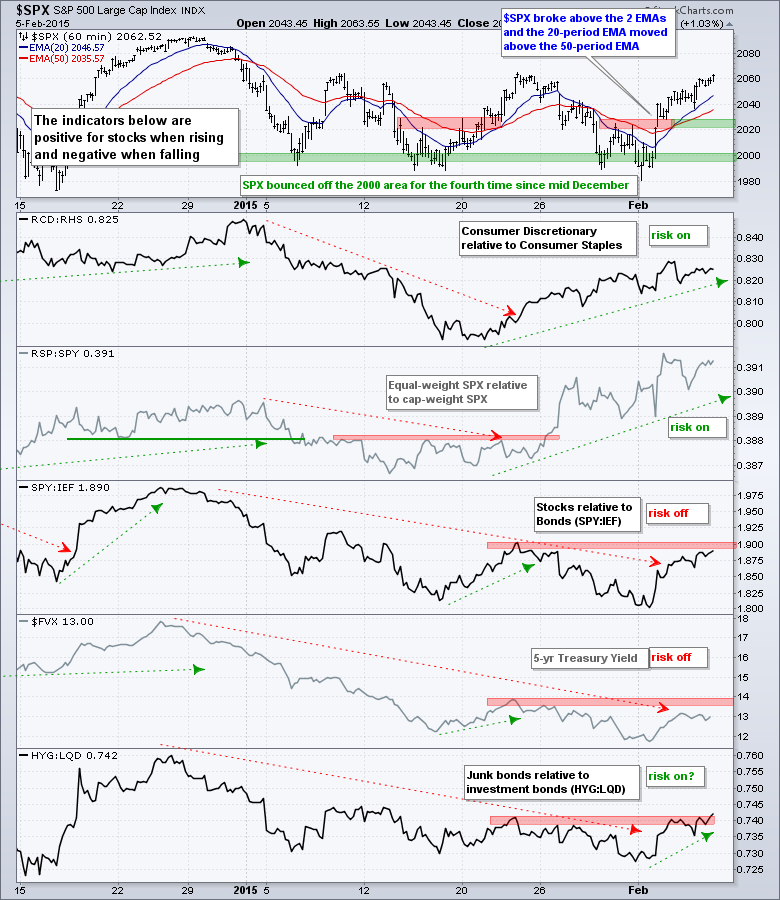
- Three of the five risk indicators are positive.
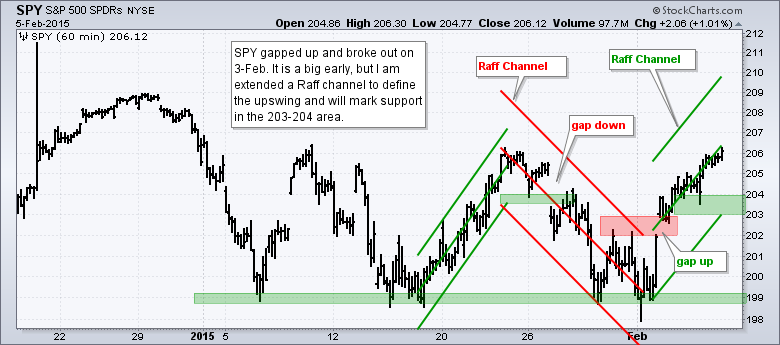
- SPY and IWM broke out with gaps and strong moves on 3-Feb.
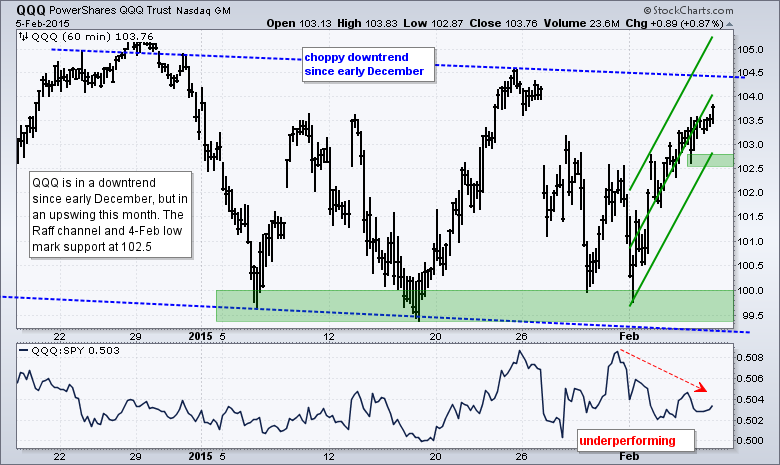
- QQQ is in an upswing, but within a choppy range since December.
- TLT formed an island reversal over the last few days and is testing support ahead of the employment report.
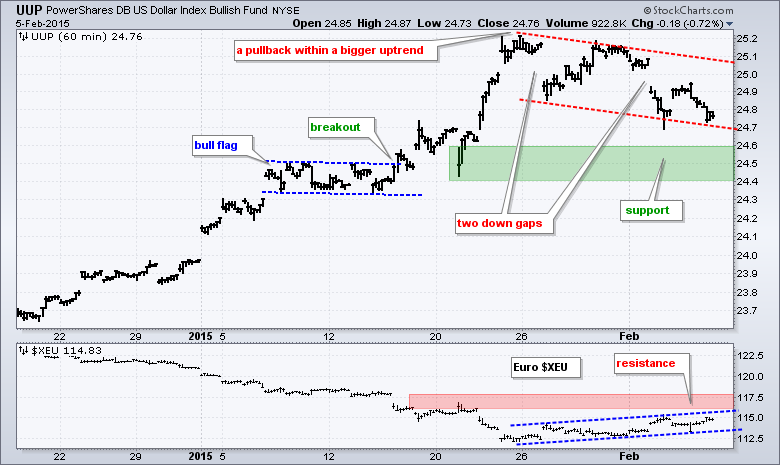
- UUP fell over the last two weeks, but this looks like a pullback within a bigger uptrend.
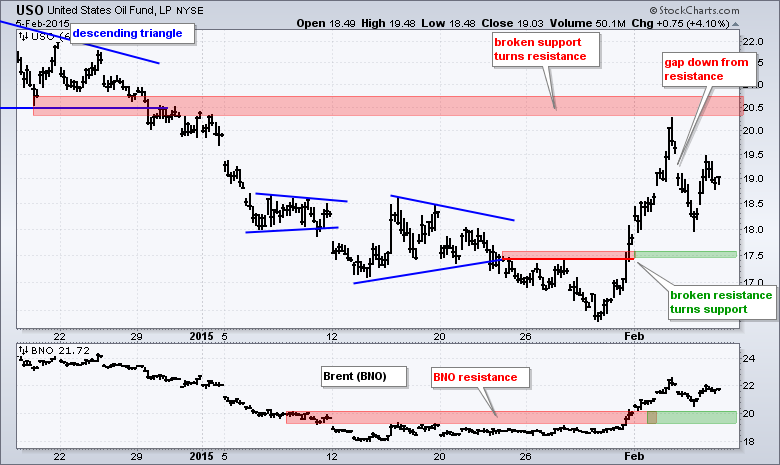
- USO is choppy and untradeable.
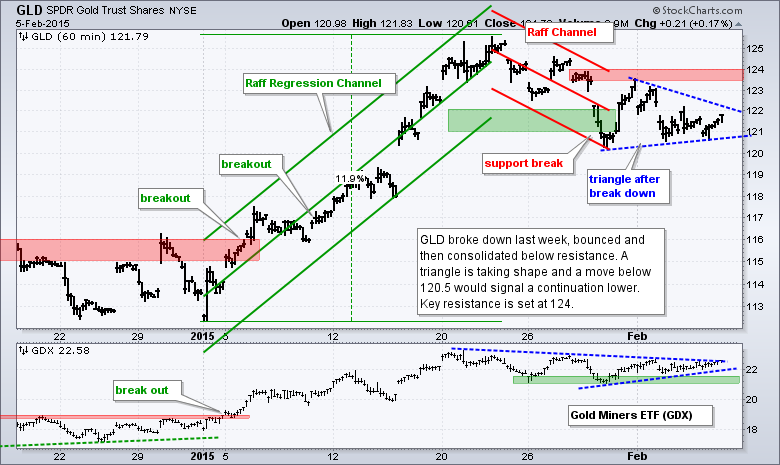
- GLD broke down on 29-Jan and is consolidating within a short-term downtrend.
The E-mini extended its bounce and closed above 2050 for the third time in five weeks. The 2050-2060 area acted as resistance in early January and late January. This will mark the third attempt to break through and continue the larger uptrend.
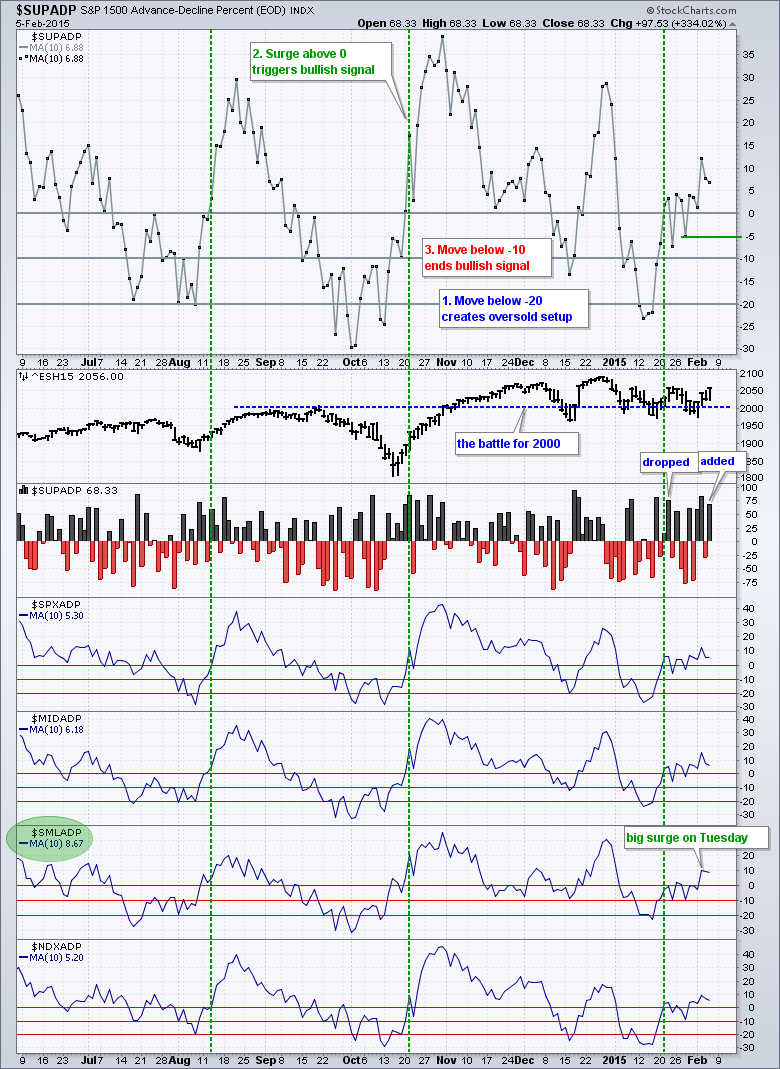
Stock market breadth remains short-term bullish. Even though S&P 1500 AD Percent ($SUPADP) finished at +68%, the 10-day SMA ticked down. How can this be? Well, a moving average moves. The breadth surge on 22-Jan (+76%) was dropped and Thursday's breadth surge was added (+68%). Thursday's positive breadth was less positive and this caused the 10-day SMA to decline around .08 (.76 - .68 = .08). The indicator remains bullish overall and wills stay bullish until a move below -6%.
The risk indicators are mixed. Consumer discretionary is outperforming consumer staples the last three weeks and the equal-weight S&P 500 is outperforming the cap-weight S&P 500. The stock-bond ratio (SPY:IEF) surged this week and is close to a breakout that would be positive for stocks. The HYG:LQD ratio also surged and exceeded its late January high. This is the first sign that junk bonds are starting to outperform investment grade bonds again.
The short-term evidence is currently bullish. Breadth remains strong overall with small-caps showing leadership in February. The risk indicators are net positive with three showing risk-on. SPY and IWM broke out with gaps on Tuesday morning and continued higher. The gaps and breakouts are holding. I added some Raff Regression Channels to the charts to define the current upswing and mark short-term support.
**************************************************************
**************************************************************
**************************************************************
**************************************************************
**************************************************************
**************************************************************
***************************************************************
Key Reports and Events (all times Eastern):
Fri - Feb 06 - 08:30 - Employment Report
Tue - Feb 10 - 10:00 - JOLTS Jobs Report
Wed - Feb 11 - 07:00 - MBA Mortgage Index
Wed - Feb 11 - 10:30 - Oil Inventories
Thu - Feb 12 - 08:30 - Initial Jobless Claims
Thu - Feb 12 - 08:30 - Retail Sales
Thu - Feb 12 - 10:30 - Natural Gas Inventories
Fri - Feb 13 - 09:55 - Michigan Sentiment
Tue - Feb 17 - 08:30 - Empire Manufacturing
Tue - Feb 17 - 10:00 - NAHB Housing Market Index
Wed - Feb 18 - 07:00 - MBA Mortgage Index
Wed - Feb 18 - 08:30 - Housing Starts/Building Permits
Wed - Feb 18 - 08:30 - Producer Price Index (PPI)
Wed - Feb 18 - 09:15 - Industrial Production
Wed - Feb 18 - 14:00 - FOMC Minutes
Thu - Feb 19 - 08:30 - Initial Jobless Claims
Thu - Feb 19 - 10:00 - Philadelphia Fed
Thu - Feb 19 - 10:00 - Leading Indicators
Thu - Feb 19 - 10:30 - Natural Gas Inventories
Thu - Feb 19 - 11:00 - Oil Inventories
Mon - Feb 23 - 10:00 - Existing Home Sales
Tue - Feb 24 - 09:00 - Case-Shiller 20-city Index
Tue - Feb 24 - 10:00 - Consumer Confidence
Wed - Feb 25 - 07:00 - MBA Mortgage Index
Wed - Feb 25 - 10:00 - New Home Sales
Wed - Feb 25 - 10:30 - Oil Inventories
Thu - Feb 26 - 08:30 - Initial Jobless Claims
Thu - Feb 26 - 08:30 - Consumer Price Index (CPI)
Thu - Feb 26 - 08:30 - Durable Goods Orders
Thu - Feb 26 - 09:00 - FHFA Housing Price Index
Thu - Feb 26 - 10:30 - Natural Gas Inventories
Fri - Feb 27 - 08:30 - GDP
Fri - Feb 27 - 09:45 - Chicago PMI
Fri - Feb 27 - 09:55 - Michigan Sentiment
Fri - Feb 27 - 10:00 - Pending Home Sales
This commentary is designed to stimulate thinking. This analysis is not a recommendation to buy, sell, hold or sell short any security (stock ETF or otherwise). We all need to think for ourselves when it comes to trading our own accounts. First, it is the only way to really learn. Second, we are the only ones responsible for our decisions. Think of these charts as food for further analysis. Before making a trade, it is important to have a plan. Plan the trade and trade the plan. Among other things, this includes setting a trigger level, a target area and a stop-loss level. It is also important to plan for three possible price movements: advance, decline or sideways. Have a plan for all three scenarios BEFORE making the trade. Consider possible holding times. And finally, look at overall market conditions and sector/industry performance.


