-- S&P 500 and Nasdaq 100 Make Breakout Bids (creating unique charts)
-- High-Low Percent Indicators Stay Bullish
-- Bounce in T-Yields Lifts Financials
-- XSD Shows Chart Strength (finding ETF holdings)
-- Materials Sector Springs to Life
-- Treasury Yields Bounce
-- Dollar Jumps
-- Gold Falls
-- Economic Indicators Support Bull Market (using the St Louis Fed database)
**************************************************************
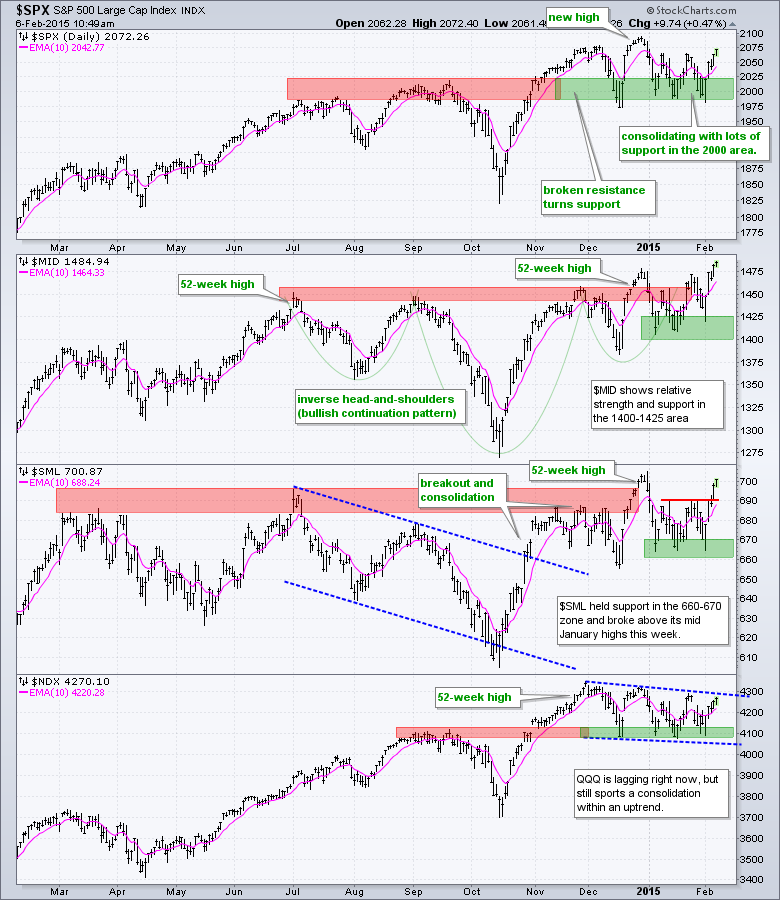
S&P 500 and Nasdaq 100 Make Breakout Bids
Chart 1 shows the S&P 500, S&P MidCap 400, S&P Small-Cap 600 and Nasdaq 100 for easy reference. All four are in long-term uptrends because they all hit new highs in late December. The S&P MidCap 400 is the chart leader because it was the first to hit another new high this week. I noted that small and mid caps were perking up in last Friday's Market Message, and John Murphy noted relative strength in mid-caps in Thursday's Market Message. Mid-caps represent a sweet spot in the stock market because they sit between large-caps and small-caps. The S&P 500 and Nasdaq 100 are both lagging a bit this year, but both are challenging consolidation resistance this week. $SPX and $NDX need to break above their mid January highs to end these consolidations and signal a continuation higher.
**************************************************************
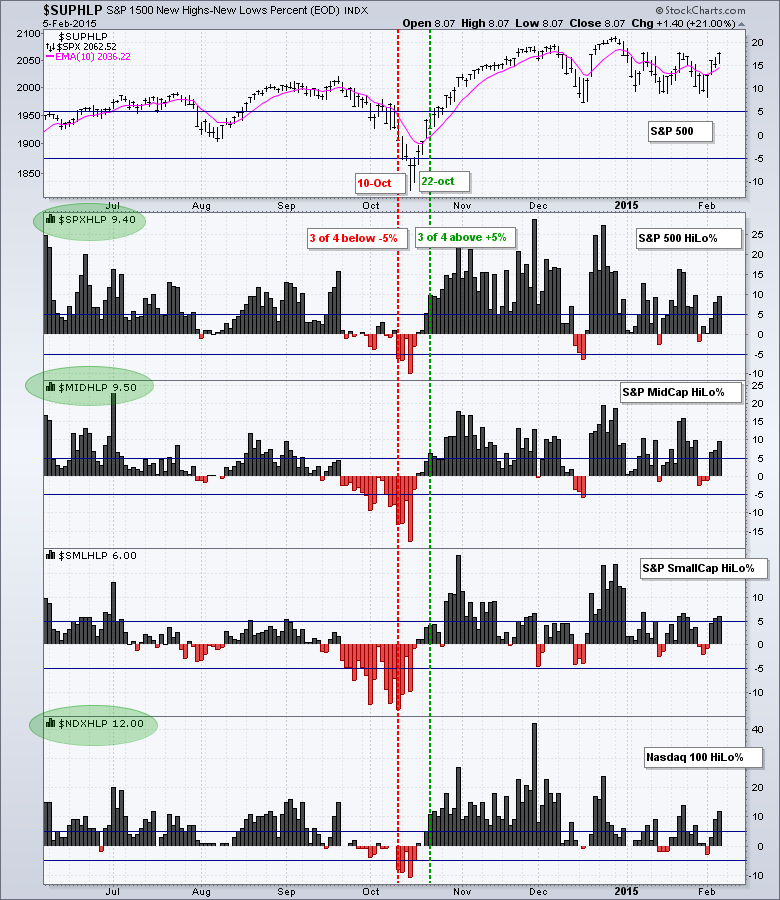
High-Low Percent Indicators Stay Bullish
Chart 2 shows High-Low Percent for the S&P 500, S&P MidCap 400, S&P Small-Cap 600 and Nasdaq 100. This indicator group has been bullish on the stock market since all four surged above +5% on October 22nd. There was a bear scare in mid December when two of the four dipped below -5%, but this quickly evaporated as all four moved back above +5% a few days later. Even though we saw some small dips into negative territory in January, none of them came close to -5% and all four moved back above +5% this week.
**************************************************************
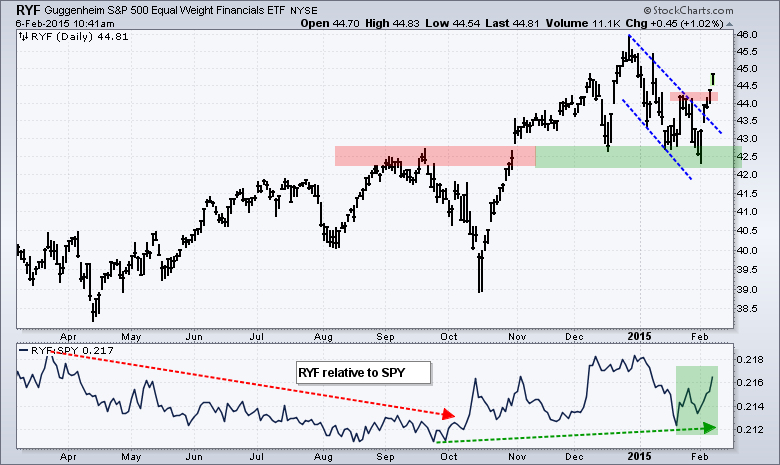
Bounce in T-Yields Lifts Financials
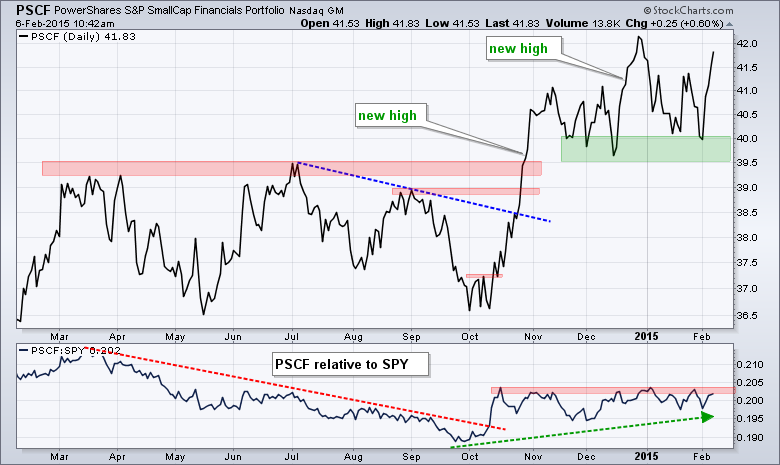
After a sharp decline in January, Treasury yields are bouncing in February and this is helping the finance sector. Chart 3 shows the Finance SPDR (XLF) with a green line depicting the long-term uptrend and the red Raff Regression Channel showing a correction within this uptrend. The ETF was hit hard in January as the 5-year Treasury Yield ($FVX) moved below 1.2% and to its lowest level in over a year. The indicator window shows the 5-year Treasury Yield bouncing back above 1.4% today and XLF is reacting positively with a breakout at 24.25. Chart 4 shows the Equal-weight Finance ETF (RYF) holding its breakout zone and moving above short-term resistance this week. Chart 5 shows the Small-Cap Financials ETF (PSCF) holding support in the 39.5-40 area and surging above 41.5 this week.

**************************************************************
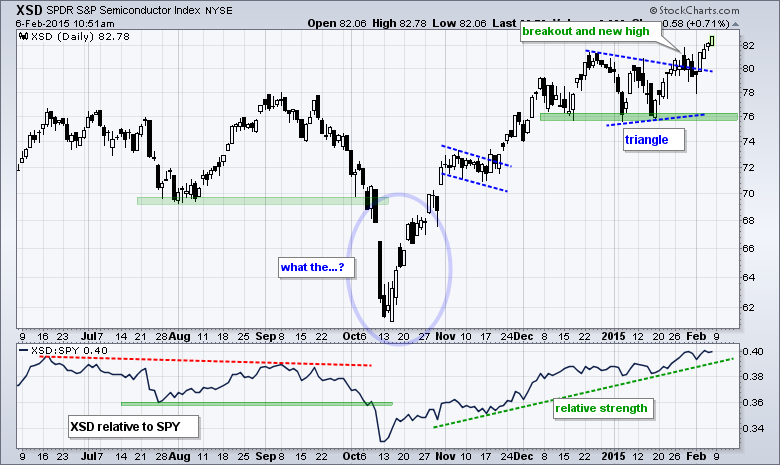
XSD Shows Chart Strength
QQQ may be lagging a bit, but the Semiconductor SPDR (XSD) is not. Chart 6 shows XSD hitting a new high in late December, stalling with a triangle in January and breaking out at the end of January. The ETF moved above 82 this week and hit another new high. The indicator window shows the price relative (XSD:SPY ratio) confirming relative strength with a new high this week.
**************************************************************
Materials Sector Springs to Life
Chart 7 shows the Materials SPDR (XLB) and three relative performance indicators. On the price chart, XLB surged in October-November and then consolidated in December-January with a triangle of sorts. Trading was certainly choppy within the triangle, but the ETF finally made a decisive move with a break above the December-January highs. This move signals a continuation of the Oct-Nov advance and projects a move to new highs. Chartists can mark support in the 46.5-47 area. Within the group, note that Air Products (APD), DuPont (DD), Mosaic (MOS), Sherwin William (SHW) and Vulcan Materials (VMC) hit new highs this week.
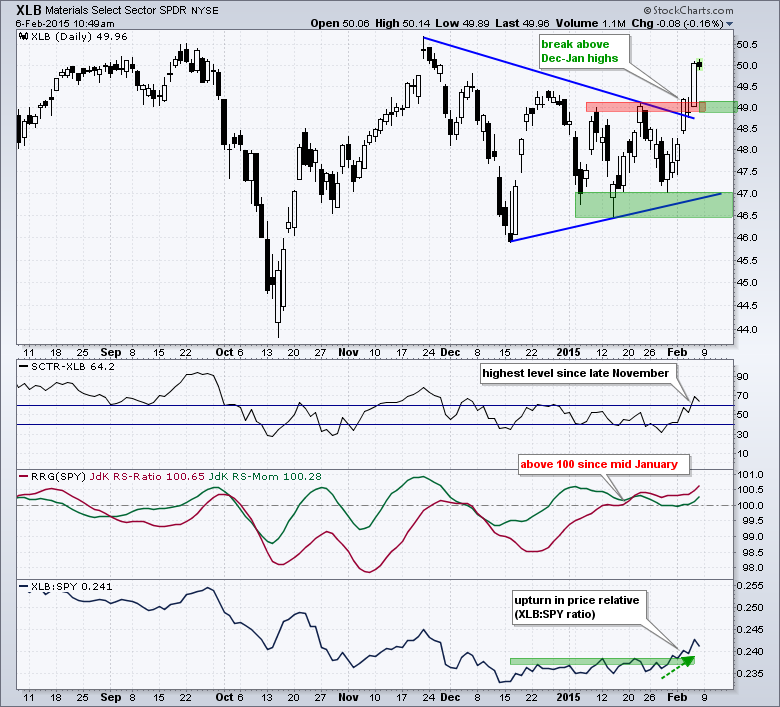
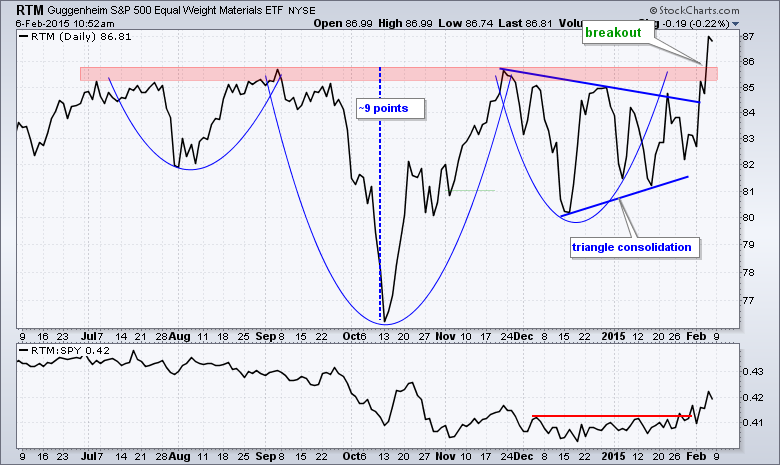
The indicator windows show the StockCharts Technical Rank (SCTR), the Relative Rotation Graph indicators and the price relative. All three are measuring relative performance against the S&P 500 SPDR and all three reflect relative strength in XLB. The SCTR moved above 60 and to its highest level since late November. The RS-Ratio line (red) moved into above 100 in mid January and remains well above 100. The price relative (XLB:SPY ratio) broke above its January highs with an upturn the last two weeks. Chart 8 shows the Equal-weight Materials ETF (RTM) breaking above resistance from a large inverse head-and-shoulders pattern. Based on traditional technical analysis, a move to the mid 90s is projected. The height of the pattern is added to the breakout area for an upside target.
**************************************************************
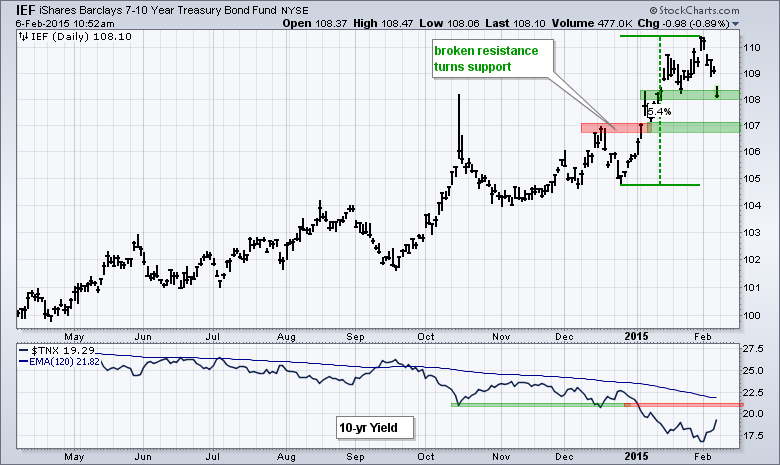
Treasury Yields Bounce
The 7-10 YR T-Bond ETF (IEF) fell sharply and the 10-YR Treasury Yield ($TNX) surged after the non-farm payrolls report on Friday. Despite a sharp decline this week, the overall trend for IEF remains up. Chart 9 shows IEF hitting a new high last week with a 5+ percent advance in six weeks. This sharp advance created an overbought condition that made IEF vulnerable to a correction. The mid January low marks first support in the 108 area. Broken resistance marks second support in the 106.5-107 area.
**************************************************************
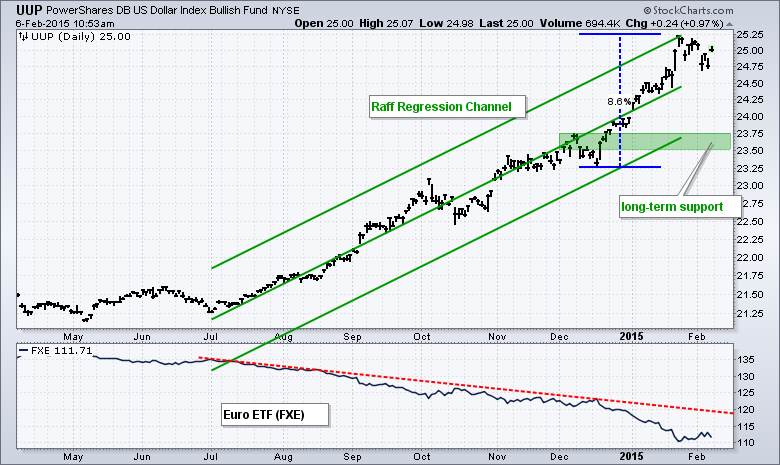
Dollar Jumps
The surge in Treasury yields put a bid into the Dollar as the US Dollar ETF (UUP) advanced around 1%. Chart 10 shows UUP in a strong uptrend and also overbought in late January. The ETF was up over 8% in six weeks and ripe for a rest. This rest came with a pullback to the 24.75 area this week. Even though UUP still looks overbought, the overall trend is clearly up and the bulls have the edge.
**************************************************************
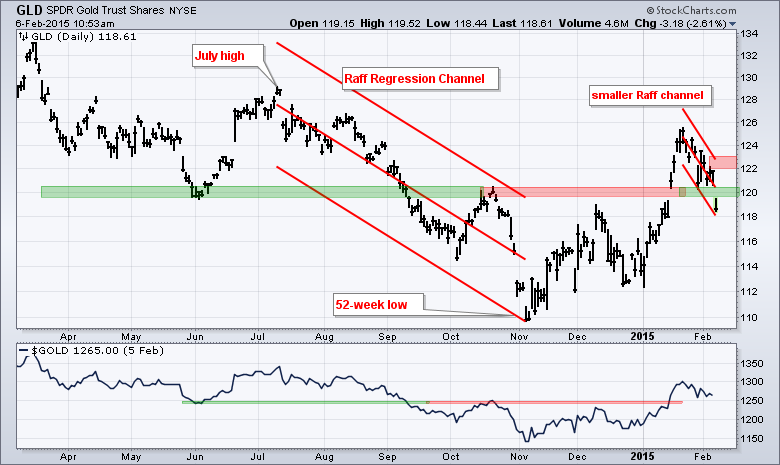
Gold Falls
Chart 11 shows the Gold SPDR (GLD) breaking out in mid January and negating this breakout with a move back below the breakout zone. The decline over the last two weeks looks like a falling flag, but the bigger downtrend is pulling trump right now. Note that the long-term trend for gold is down because GLD hit a 52-week low in early November. The November-January advance triggered a break above broken resistance, but the ETF did not even challenge the prior high in July. I am now drawing a smaller Raff Regression Channel to define the immediate downswing and mark resistance at 123.
**************************************************************
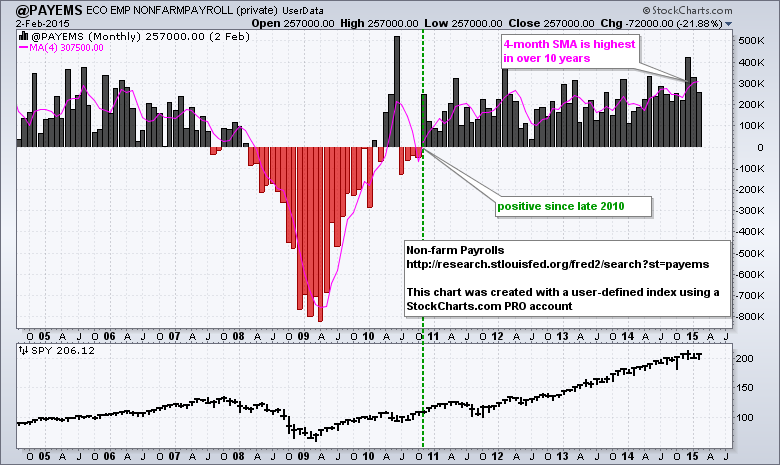
Economic Indicators Support Bull Market
The image below shows a simple table that I created in Excel with some color-coding. I update by hand every month by putting in the numbers and include in in my commentary at least once a month. It cannot be found on the website and is not updated in real time. Almost all the data comes from the St Louis Fed database (research.stlouisfed.org). The ADP data from the ADP website and the yield curve comes from StockCharts.
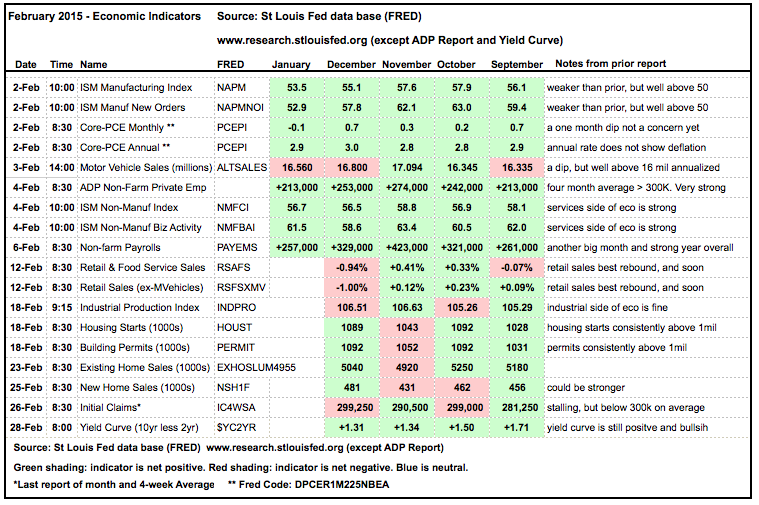
The economic indicators support a long-term uptrend in the stock market. The ISM Manufacturing Index and ISM Services Index fell back this month, but both remain comfortably above 50, which favors an economic expansion. Non-farm payrolls knocked it out of the park over the last four months and the four-month average is 332,000. Chart 13 shows the four month average at its highest level in over ten years. Next week will be important for Retail Sales because this indicator fell last month.