Stocks were hit with some selling pressure on Friday, but the week as a whole showed some pretty positive price action. SPY began its advance on Monday, gapped up on Tuesday and then worked its way higher until Friday morning. Selling pressure hit in the afternoon, but SPY still managed a 3% gain for the week. The consumer discretionary SPDR advanced over 4% with help from the Home Construction iShares (+5.21%) and the Retail SPDR (+3.28%). Banks caught a bid as the 5-year Treasury Yield ($FVX) surged from 1.175% to 1.465%. The Finance SPDR (XLF) was up over 5% and the Regional Bank SPDR (KRE) was up over 8%. Even though trading remains choppy this year and there are pockets of weakness in the stock market, it is hard to argue with strength in the finance and consumer discretionary sectors.
**This chart analysis is for educational purposes only, and should not
be construed as a recommendation to buy, sell or sell-short said securities**
Short-term Overview (Monday, 9-February-2015):
- Short-term breadth surged for a bullish signal on 21-Jan.
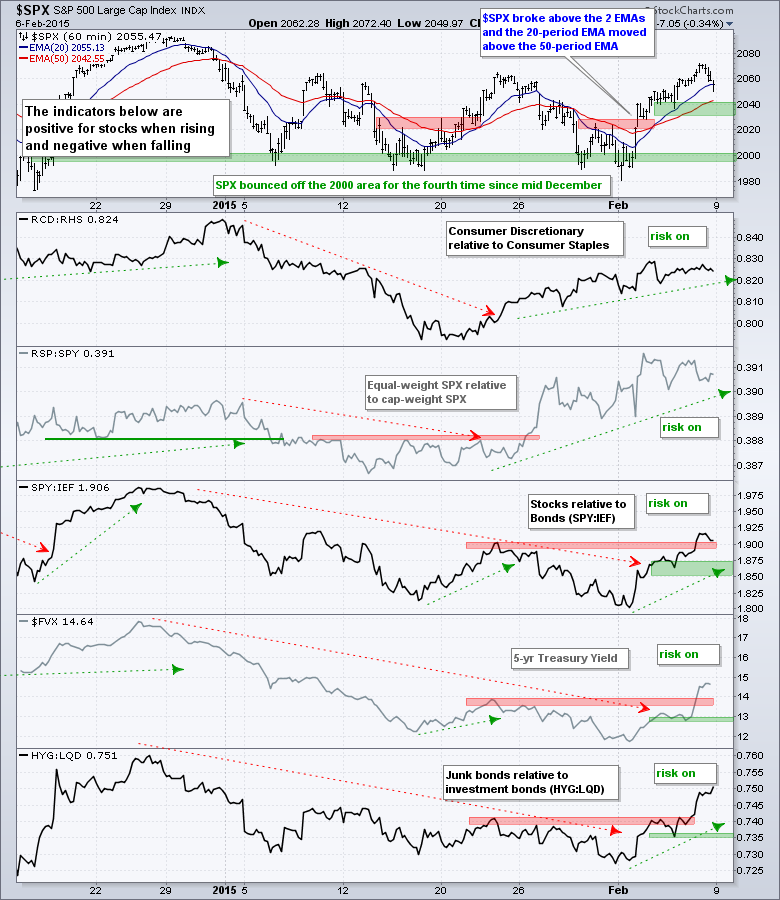
- All five risk indicators are positive.
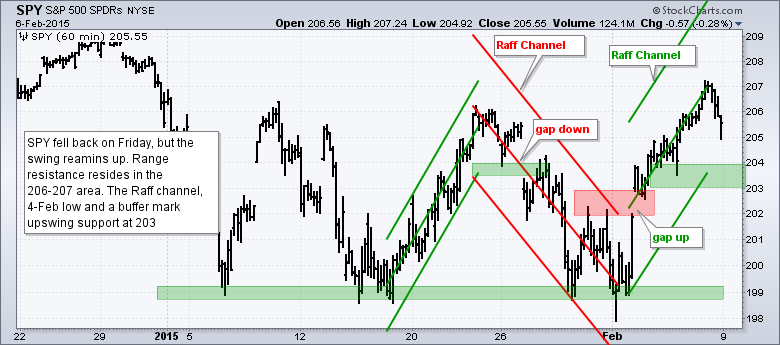
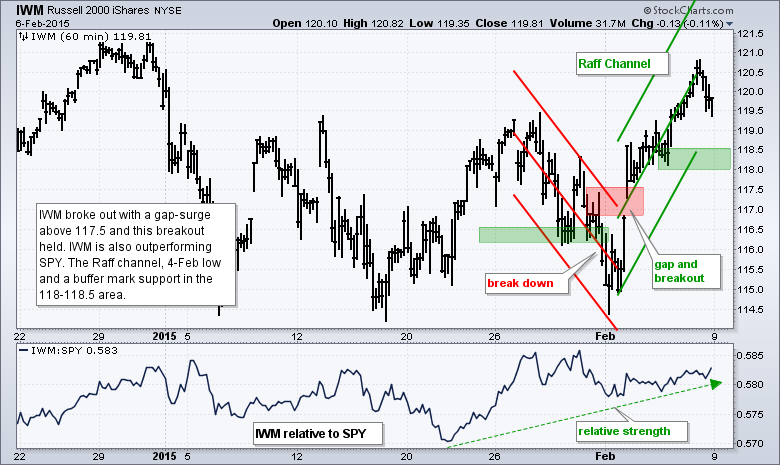
- SPY and IWM fell back on Friday, but remain within upswings and above support zones.
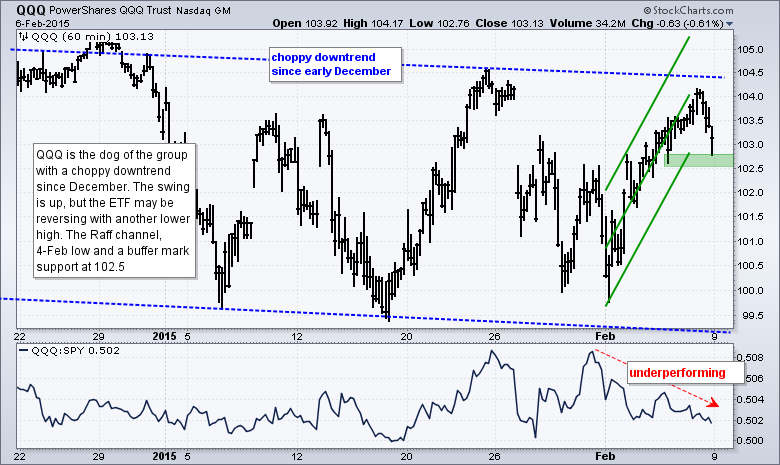
- QQQ is in an upswing, but shows relative weakness and did not exceed its late January high.
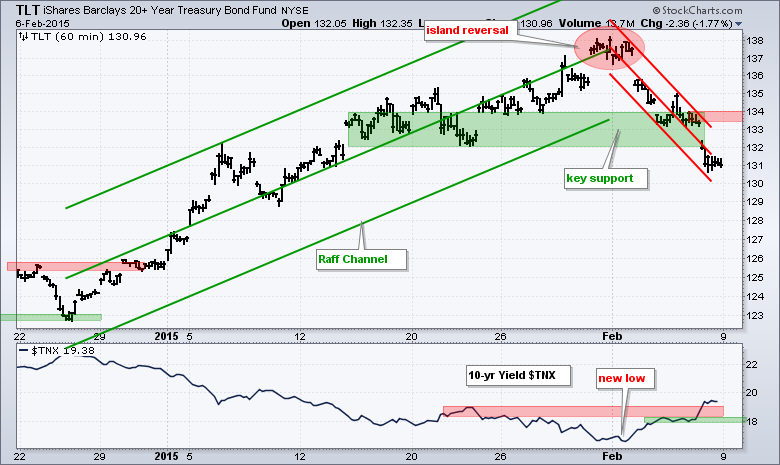
- TLT broke short-term support on Friday and the short-term trend is down.
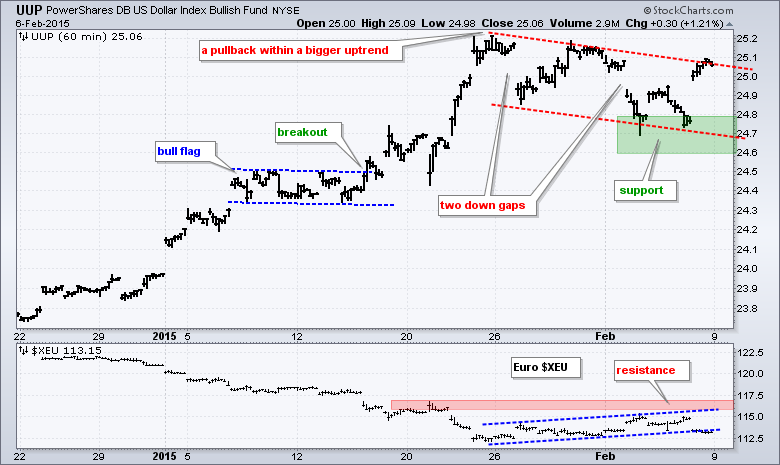
- UUP is challenging the upper trend line of a flag-like pullback.
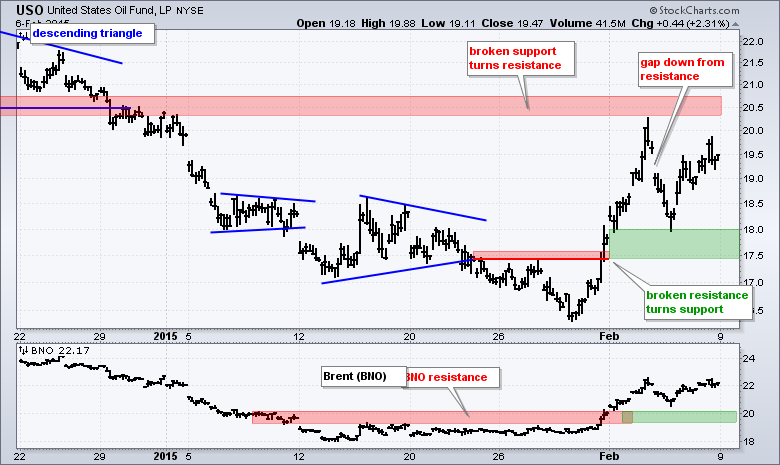
- USO is choppy and untradeable.
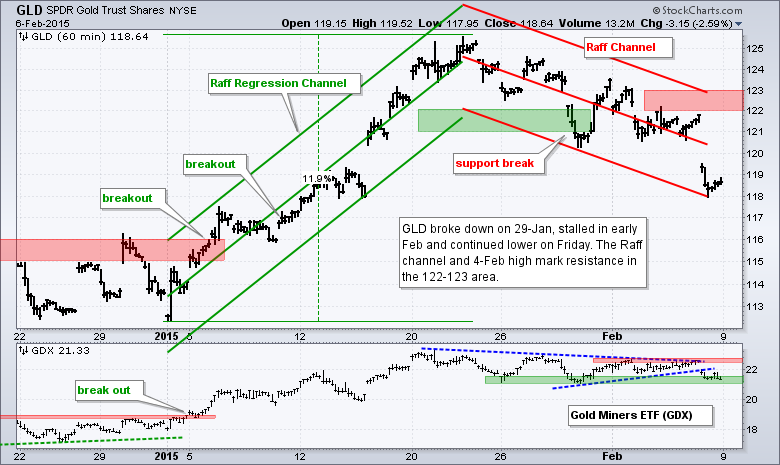
- GLD broke down on 29-Jan, stalled and moved to new lows on Friday.
The E-mini surged above 2050 on Thursday and stalled on Friday. Once again, the E-mini is hitting resistance in the 2050-2070 area. Note that the E-mini turned back in this area twice in January.
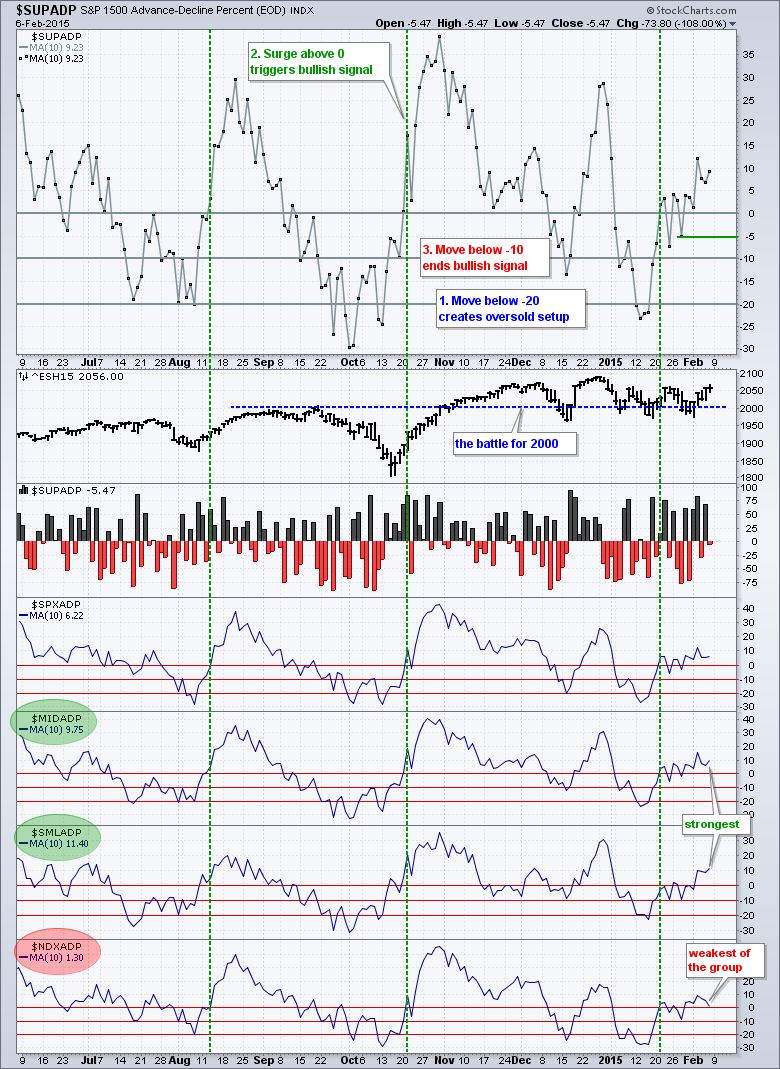
Short-term breadth is bullish overall. The 10-day SMA for S&P 1500 AD Percent ($SUPADP) moved from oversold (< -20%) to positive (> 0) and triggered a bullish signal on 21-Januaryl. Even though -10% is the ideal point to negate this signal, I am tightening this to -6% because of choppy trading. Of the five indicators, S&P SmallCap AD Percent ($SMLADP) and S&P MidCap AD Percent ($MIDADP) are the strongest because their 10-day SMAs are at +11.40% and +9.75%, respectively. The Nasdaq 100 AD Percent ($NDXADP) is the weakest because its 10-day SMA is barely positive. As a group, large-cap techs are lagging.
All five risk indicators are positive. The two stock-specific indicators were positive and the three bond-related indicators turned positive on Friday. Note that SPY is now outperforming IEF as the SPY:IEF ratio broke above the mid January high. The 5-year Treasury Yield ($FVX) surged above its mid January high as money moved out of short-term Treasuries, which is positive for stocks. The JNK:LQD ratio surged to its highest level since late December as junk bonds caught a relative bid.
The short-term evidence remains bullish. Breadth is strong with small-caps leading. Large-cap techs, however, are lagging. All five risk indicators are bullish because Treasuries were hit hard last week. SPY and IWM broke out and their breakouts held throughout the week. QQQ is lagging. Short-term, I am concerned because the stock market is a little overbought and range resistance is coming into play for SPY. Yes, the S&P 500 is still stuck in its range and trading could remain choppy. QQQ is also a concern because another lower high could be forming and the ETF is lagging the broader market.
**************************************************************
**************************************************************
**************************************************************
**************************************************************
**************************************************************
**************************************************************
***************************************************************
Key Reports and Events (all times Eastern):
Tue - Feb 10 - 10:00 - JOLTS Jobs Report
Wed - Feb 11 - 07:00 - MBA Mortgage Index
Wed - Feb 11 - 10:30 - Oil Inventories
Thu - Feb 12 - 08:30 - Initial Jobless Claims
Thu - Feb 12 - 08:30 - Retail Sales
Thu - Feb 12 - 10:30 - Natural Gas Inventories
Fri - Feb 13 - 09:55 - Michigan Sentiment
Tue - Feb 17 - 08:30 - Empire Manufacturing
Tue - Feb 17 - 10:00 - NAHB Housing Market Index
Wed - Feb 18 - 07:00 - MBA Mortgage Index
Wed - Feb 18 - 08:30 - Housing Starts/Building Permits
Wed - Feb 18 - 08:30 - Producer Price Index (PPI)
Wed - Feb 18 - 09:15 - Industrial Production
Wed - Feb 18 - 14:00 - FOMC Minutes
Thu - Feb 19 - 08:30 - Initial Jobless Claims
Thu - Feb 19 - 10:00 - Philadelphia Fed
Thu - Feb 19 - 10:00 - Leading Indicators
Thu - Feb 19 - 10:30 - Natural Gas Inventories
Thu - Feb 19 - 11:00 - Oil Inventories
Mon - Feb 23 - 10:00 - Existing Home Sales
Tue - Feb 24 - 09:00 - Case-Shiller 20-city Index
Tue - Feb 24 - 10:00 - Consumer Confidence
Wed - Feb 25 - 07:00 - MBA Mortgage Index
Wed - Feb 25 - 10:00 - New Home Sales
Wed - Feb 25 - 10:30 - Oil Inventories
Thu - Feb 26 - 08:30 - Initial Jobless Claims
Thu - Feb 26 - 08:30 - Consumer Price Index (CPI)
Thu - Feb 26 - 08:30 - Durable Goods Orders
Thu - Feb 26 - 09:00 - FHFA Housing Price Index
Thu - Feb 26 - 10:30 - Natural Gas Inventories
Fri - Feb 27 - 08:30 - GDP
Fri - Feb 27 - 09:45 - Chicago PMI
Fri - Feb 27 - 09:55 - Michigan Sentiment
Fri - Feb 27 - 10:00 - Pending Home Sales
This commentary is designed to stimulate thinking. This analysis is not a recommendation to buy, sell, hold or sell short any security (stock ETF or otherwise). We all need to think for ourselves when it comes to trading our own accounts. First, it is the only way to really learn. Second, we are the only ones responsible for our decisions. Think of these charts as food for further analysis. Before making a trade, it is important to have a plan. Plan the trade and trade the plan. Among other things, this includes setting a trigger level, a target area and a stop-loss level. It is also important to plan for three possible price movements: advance, decline or sideways. Have a plan for all three scenarios BEFORE making the trade. Consider possible holding times. And finally, look at overall market conditions and sector/industry performance.


