Stocks started the day weak with selling pressure on the open, but quickly firmed around 10AM and the S&P 500 surged above 2000 before lunch. After an early afternoon swoon, buyers stepped in again and pushed this key benchmark back above 2000. In fact, the index closed above 2020 and is already challenging Friday's high. The 2000 area has again come through and held as support for the S&P 500. The overall gains were modest as SPY added 1.24%, QQQ gained .87% and IWM advanced .92%. Energy shares led the gainers as oil got an oversold bounce. Banks were also strong as the Finance SPDR (XLF) gained 1.61% and the Regional Bank SPDR (KRE) surged 2.85%.
**This chart analysis is for educational purposes only, and should not
be construed as a recommendation to buy, sell or sell-short said securities**
Short-term Overview (Tuesday, 3-February-2015):
- All Five AD Lines are in short-term downtrends.
- The three bond-related risk indicators remain negative.
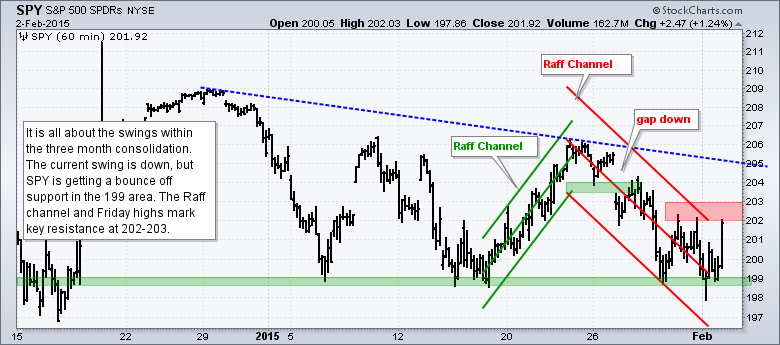
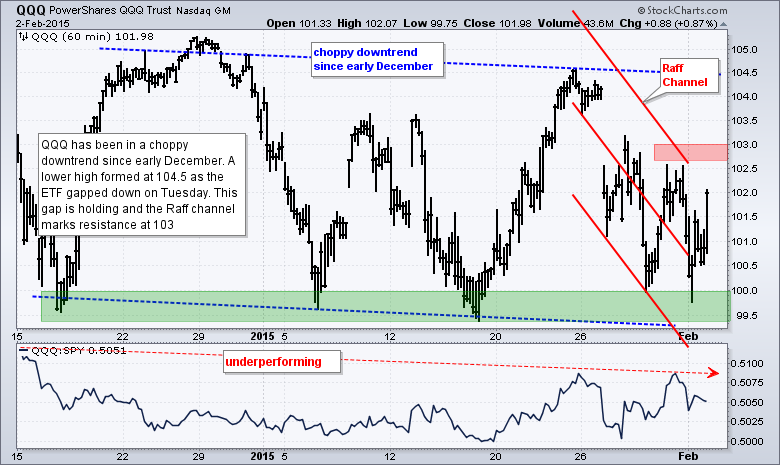
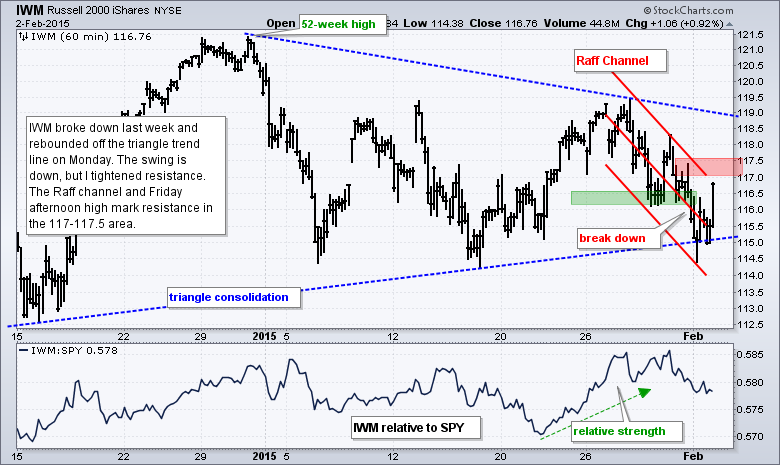
- QQQ, SPY and IWM bounced off support, but did not break out and remain in downswings.
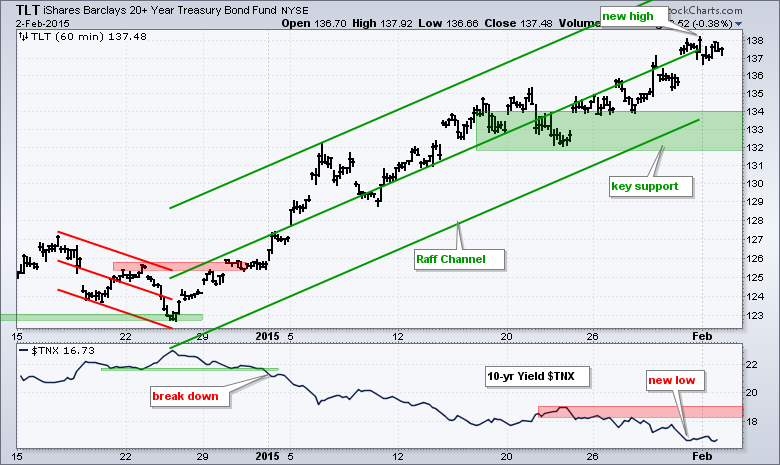
- TLT hit another new high on Friday and continues to outperform SPY.
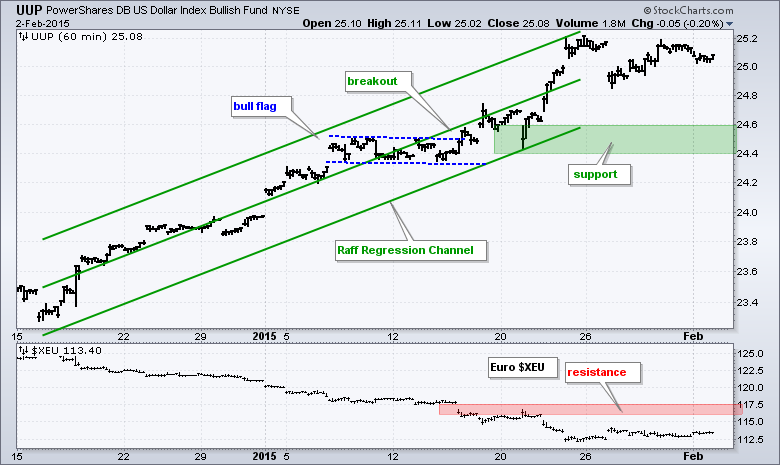
- UUP is back near its highs and in an uptrend.
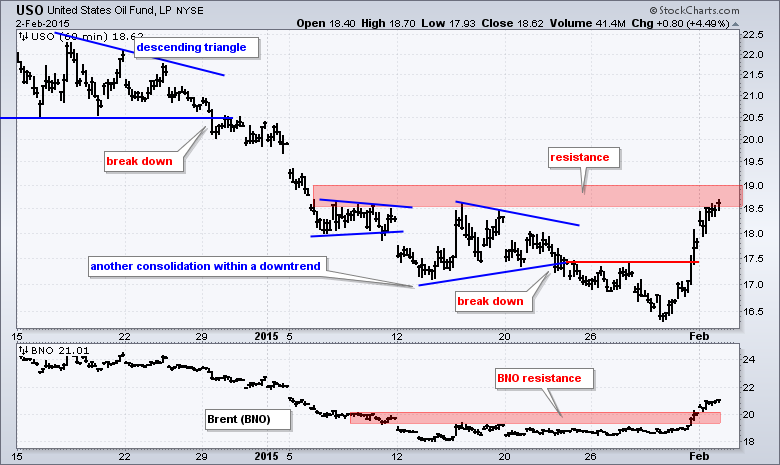
- USO got a big oversold bounce within a downtrend.
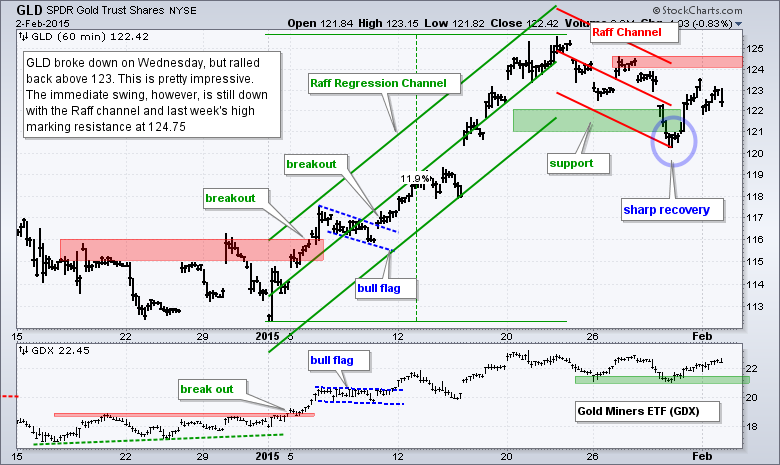
- GLD recovered after the 29-Jan support break, but the swing remains down.
For the fourth time since early January, the E-mini closed below 2000 one day and moved right back above 2000 the next (red dotted line). Once again, the 1980-2000 area is acting as support and the triangle remains in play.
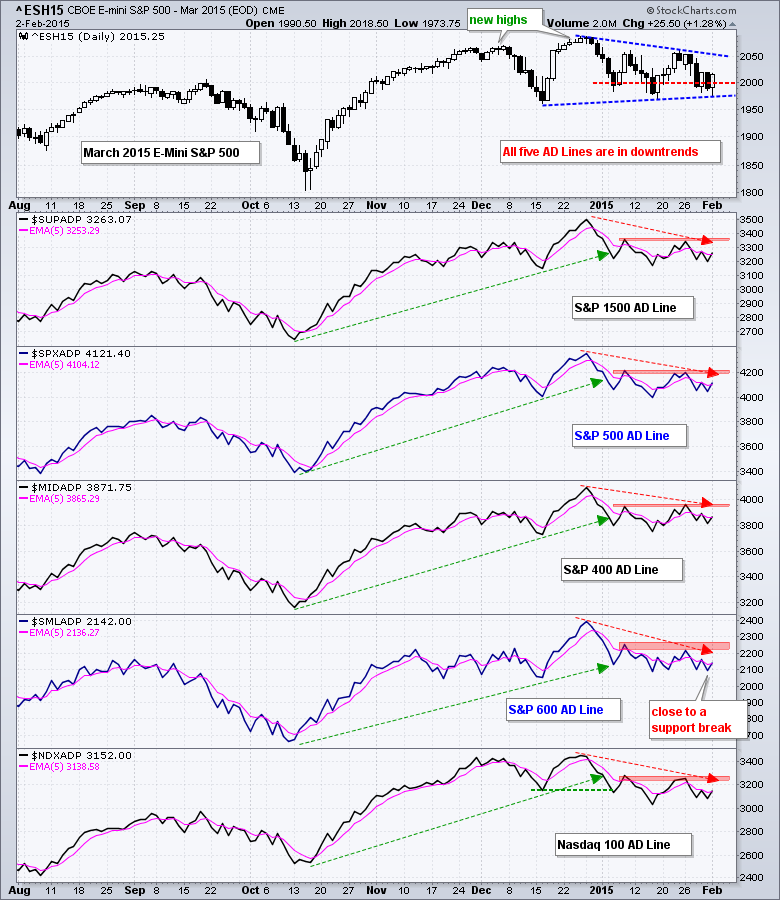
All five AD Lines are in downtrends, but all five ticked higher and broke above their 5-day EMAs. As with the stock market, the AD Lines have been pretty much flat since January. The red zones mark resistance and breakouts here are needed to turn fully bullish on breadth again.
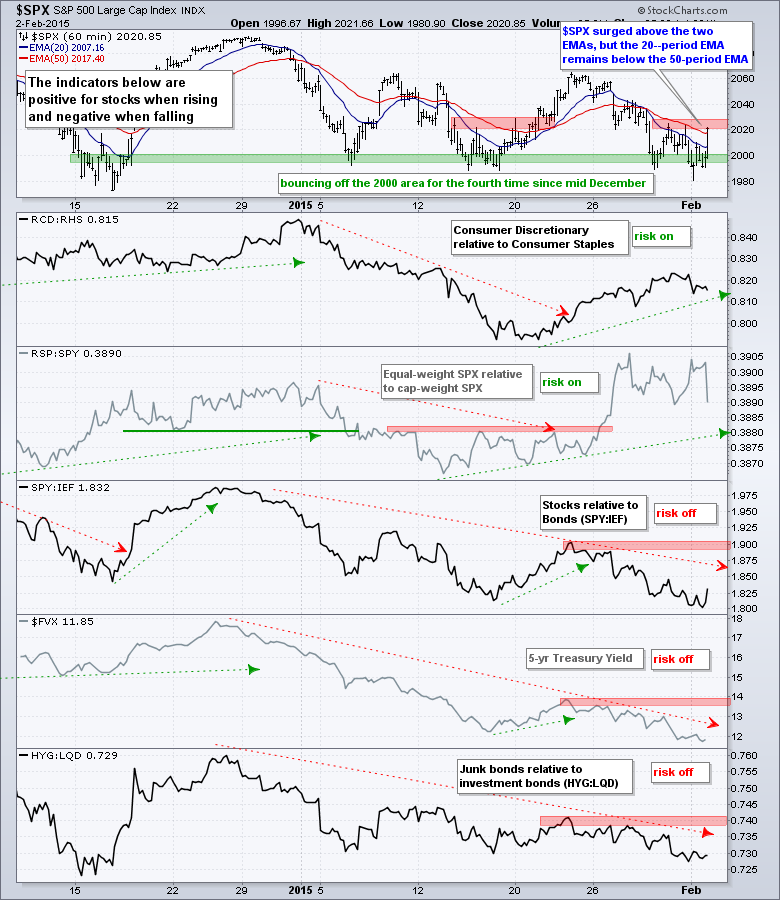
Three of the five risk indicators remain negative. No change. The two stock-specific indicators are holding up, but the bond-related indicators hit new lows for the move. Note that SPY is underperforming the 7-10 YR T-Bond ETF (IEF), the 5-year Treasury Yield ($FVX) hit a new low for the year and the HYQ:LQD ratio ended below its mid January low (junk bonds lagging investment grade bonds). These indicators point to risk aversion in the market place right now.
The stock market continues to trade choppy and the major index ETFs remain in consolidation patterns since mid November. There have been upswings and downswings, but the only way to profitably trade these is to buy near support and sell near resistance. A swing reversal will hold one day, but volatility and chop remains the order of the day right now. SPY, QQQ and IWM remain in downswings, but all three bounced off support levels that extend back to early January.
**************************************************************
**************************************************************
**************************************************************
**************************************************************
**************************************************************
**************************************************************
***************************************************************
Key Reports and Events (all times Eastern):
Tue - Feb 03 - 10:00 - Factory Orders
Tue - Feb 03 - 14:00 - Auto-Truck Sales
Wed - Feb 04 - 07:00 - MBA Mortgage Index
Wed - Feb 04 - 08:15 - ADP Employment Report
Wed - Feb 04 - 10:00 - ISM Services Index
Wed - Feb 04 - 10:30 - Oil Inventories
Thu - Feb 05 - 07:30 - Challenger Jobs Report
Thu - Feb 05 - 08:30 - Initial Jobless Claims
Thu - Feb 05 - 10:30 - Natural Gas Inventories
Fri - Feb 06 - 08:30 - Employment Report
Tue - Feb 10 - 10:00 - JOLTS Jobs Report
Wed - Feb 11 - 07:00 - MBA Mortgage Index
Wed - Feb 11 - 10:30 - Oil Inventories
Thu - Feb 12 - 08:30 - Initial Jobless Claims
Thu - Feb 12 - 08:30 - Retail Sales
Thu - Feb 12 - 10:30 - Natural Gas Inventories
Fri - Feb 13 - 09:55 - Michigan Sentiment
Tue - Feb 17 - 08:30 - Empire Manufacturing
Tue - Feb 17 - 10:00 - NAHB Housing Market Index
Wed - Feb 18 - 07:00 - MBA Mortgage Index
Wed - Feb 18 - 08:30 - Housing Starts/Building Permits
Wed - Feb 18 - 08:30 - Producer Price Index (PPI)
Wed - Feb 18 - 09:15 - Industrial Production
Wed - Feb 18 - 14:00 - FOMC Minutes
Thu - Feb 19 - 08:30 - Initial Jobless Claims
Thu - Feb 19 - 10:00 - Philadelphia Fed
Thu - Feb 19 - 10:00 - Leading Indicators
Thu - Feb 19 - 10:30 - Natural Gas Inventories
Thu - Feb 19 - 11:00 - Oil Inventories
Mon - Feb 23 - 10:00 - Existing Home Sales
Tue - Feb 24 - 09:00 - Case-Shiller 20-city Index
Tue - Feb 24 - 10:00 - Consumer Confidence
Wed - Feb 25 - 07:00 - MBA Mortgage Index
Wed - Feb 25 - 10:00 - New Home Sales
Wed - Feb 25 - 10:30 - Oil Inventories
Thu - Feb 26 - 08:30 - Initial Jobless Claims
Thu - Feb 26 - 08:30 - Consumer Price Index (CPI)
Thu - Feb 26 - 08:30 - Durable Goods Orders
Thu - Feb 26 - 09:00 - FHFA Housing Price Index
Thu - Feb 26 - 10:30 - Natural Gas Inventories
Fri - Feb 27 - 08:30 - GDP
Fri - Feb 27 - 09:45 - Chicago PMI
Fri - Feb 27 - 09:55 - Michigan Sentiment
Fri - Feb 27 - 10:00 - Pending Home Sales
This commentary is designed to stimulate thinking. This analysis is not a recommendation to buy, sell, hold or sell short any security (stock ETF or otherwise). We all need to think for ourselves when it comes to trading our own accounts. First, it is the only way to really learn. Second, we are the only ones responsible for our decisions. Think of these charts as food for further analysis. Before making a trade, it is important to have a plan. Plan the trade and trade the plan. Among other things, this includes setting a trigger level, a target area and a stop-loss level. It is also important to plan for three possible price movements: advance, decline or sideways. Have a plan for all three scenarios BEFORE making the trade. Consider possible holding times. And finally, look at overall market conditions and sector/industry performance.


