Stocks turned it around on Thursday with a strong open and strong close. The S&P 500 surged above 2055 on the open, held this surge and worked its way above 2065 by the close. This is positive price action, but the index remains well below Monday's high and has not fully recovered from Tuesday's plunge. Small-caps and financials led the way. We have been seeing relative strength in small-caps for some time and it played out today with a breakout in IWM. Financials got hit hard on Tuesday, but made up for it with a big surge the last two days. Within the consumer discretionary sector, we also saw strength in the Home Construction iShares (+1.3%), the Leisure and Entertainment ETF (+2.57%) and the Retail SPDR (+1.74%). Consumer discretionary remains one of the strongest sectors and this is net positive for stocks overall.
**This chart analysis is for educational purposes only, and should not
be construed as a recommendation to buy, sell or sell-short said securities**
Short-term Overview (Friday, 13-March-2015):
- Breadth bounced the last two days, but remains short-term bearish (since March 4th).
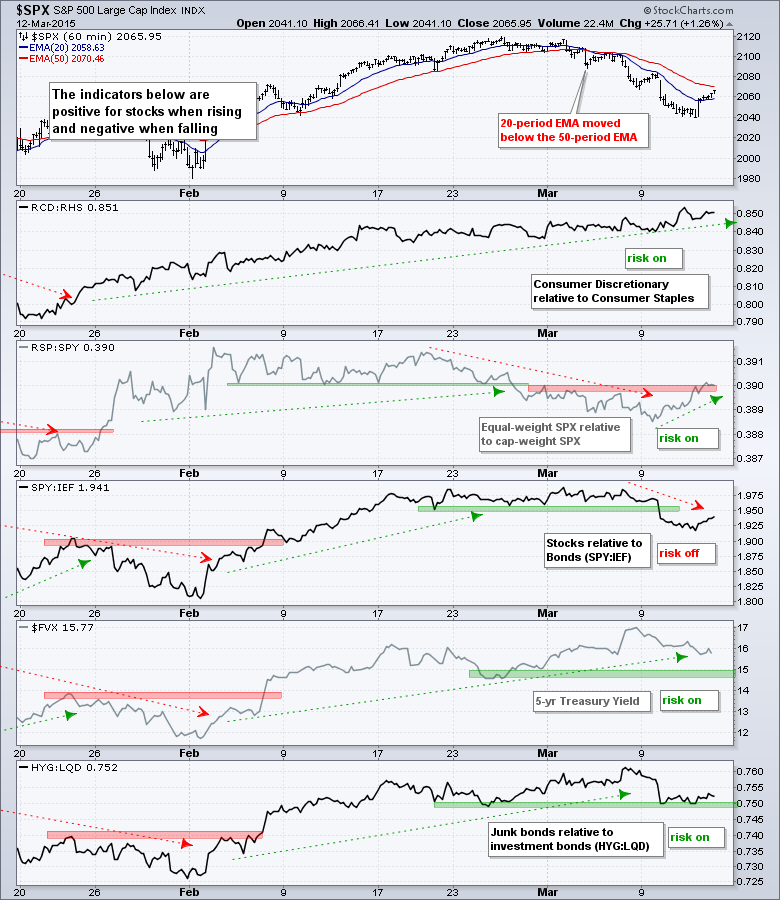
- Four of the five risk indicators are positive.
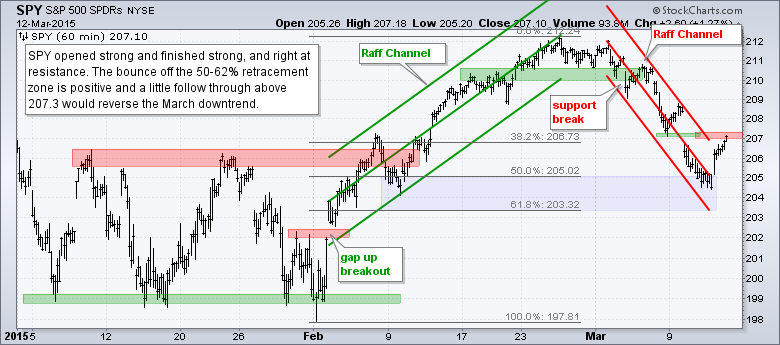
- SPY surged to resistance for a challenge to the downtrend (downtrend since March 4th)
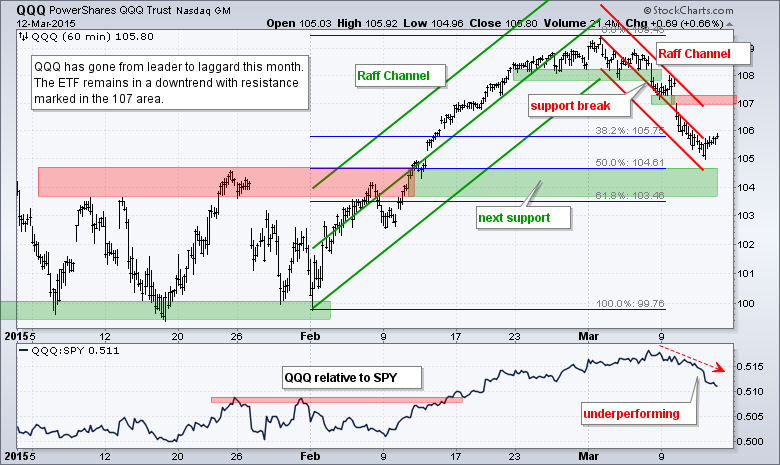
- QQQ did not bounce and shows relative weakness this month (downtrend since March 6th).
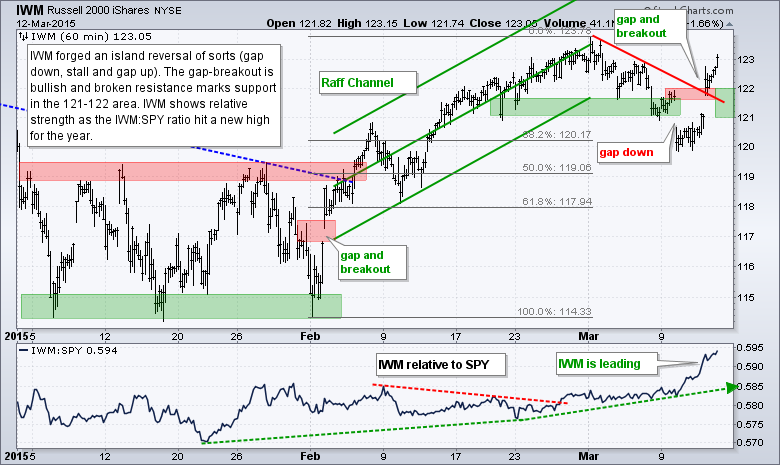
- IWM gapped up and broke resistance to start a short-term uptrend (March 12th).
- TLT exceeded its 62% retracement, but remains well below the prior high.
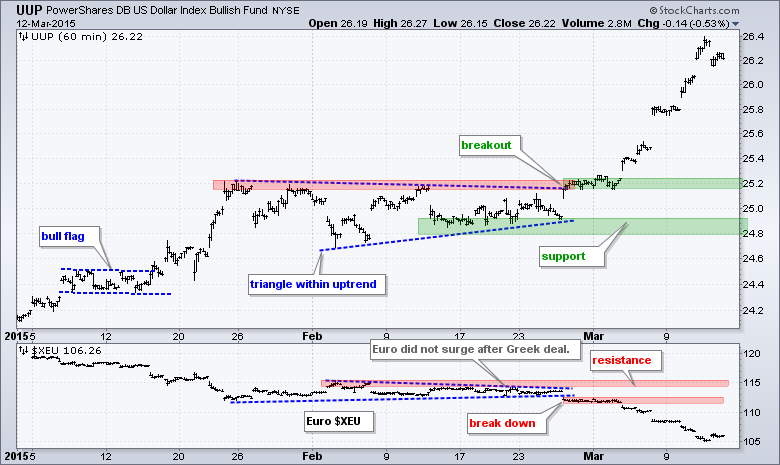
- UUP broke out of a triangle on 27-Feb and surged this month.
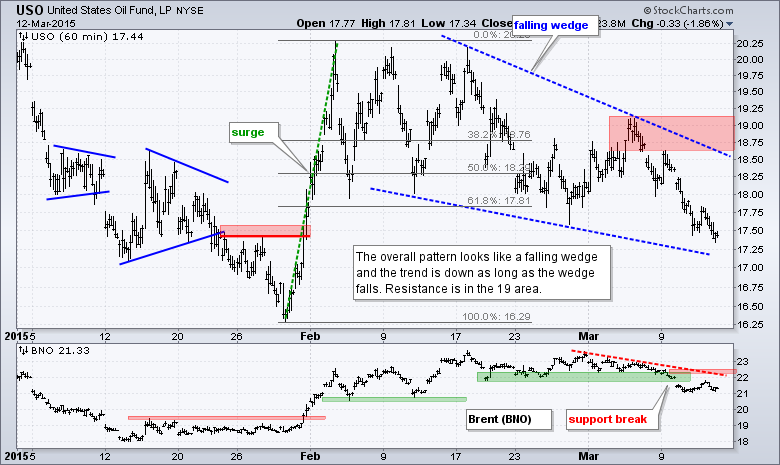
- USO remains in a downtrend defined by a falling wedge pattern.
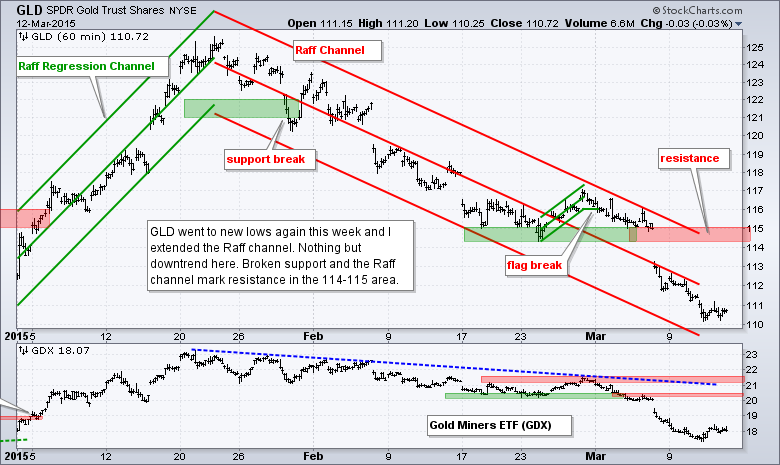
- GLD plunged to new lows again this week and has been in a downtrend since 29-Jan.
The 10-day SMA for S&P 1500 AD Percent ($SUPADP) bounced over the last two days, but this is not enough to negate the bearish signal triggered on March 4th. S&P 1500 AD Percent ($SUPADP) surged to +74.4%, which is impressive, but less impressive than the early February breadth thrust. While not all corrections will push the 10-day SMA below -20% to create the setup, I am not going to consider a bullish turn for this indicator as long as it remains below +5%. In other words, follow through is needed to turn this oversold bounce into a bullish breadth signal.
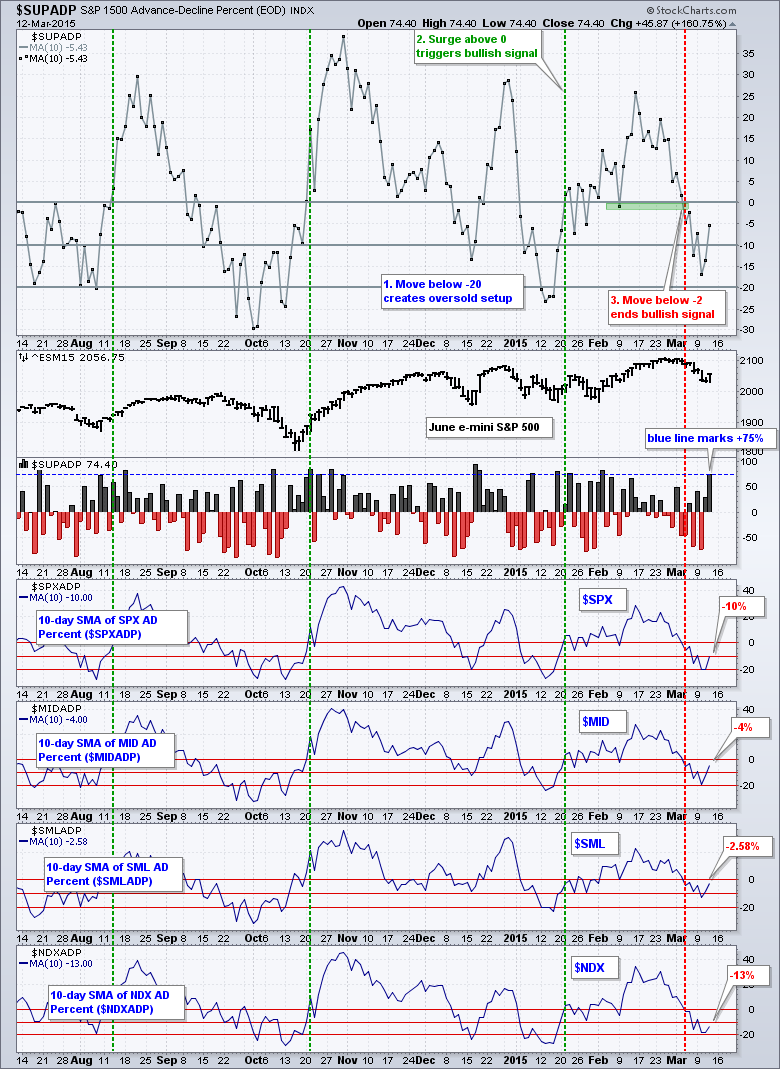
Four of the five risk indicators are negative. I upgraded the RSP:SPY ratio because the equal-weight S&P 500 has been outperforming the cap-weight S&P 500 this week and the ratio exceeded its early March highs. I may be early (wrong) on this upgrade though. The rest of the indicators are unchanged.
The evidence is mixed again. Small-caps and mid-caps are leading as IWM, IJR and MDY gapped up and broke short-term resistance levels. QQQ is lagging and barely got a bounce. SPY is somewhere in the middle, but benefitting from strength in the finance sector. Broad market breadth remains bearish, but the risk indicators are net positive. While I like the breakout in IWM, the mixed environment could lead to choppy trading.
**************************************************************

**************************************************************
**************************************************************
**************************************************************
**************************************************************
**************************************************************
***************************************************************
Key Reports and Events (all times Eastern):
Fri - Mar 13 - 08:30 - Producer Price Index (PPI)
Fri - Mar 13 - 10:00 - Michigan Sentiment
Mon - Mar 16 - 08:30 - Empire State Manufacturing
Mon - Mar 16 - 09:15 - Industrial Production
Mon - Mar 16 - 10:00 - NAHB Housing Market Index
Tue - Mar 17 - 08:30 - Building Permits-Housing Starts
Wed - Mar 18 - 07:00 - MBA Mortgage Index
Wed - Mar 18 - 10:30 - Crude Oil Inventories
Wed - Mar 18 - 14:00 - FOMC Rate Decision
Thu - Mar 19 - 08:30 - Initial Jobless Claims
Thu - Mar 19 - 10:00 - Philadelphia Fed
Thu - Mar 19 - 10:00 - Leading Economic Indicators
Thu - Mar 19 - 10:30 - Natural Gas Inventories
Mon - Mar 23 - 10:00 - Existing Home Sales
Tue - Mar 24 - 08:30 - Consumer Price Index (CPI)
Tue - Mar 24 - 09:00 - FHFA Housing Price Index
Tue - Mar 24 - 10:00 - New Home Sales
Wed - Mar 25 - 07:00 - MBA Mortgage Index
Wed - Mar 25 - 08:30 - Durable Orders
Wed - Mar 25 - 10:30 - Crude Oil Inventories
Thu - Mar 26 - 08:30 - Initial Jobless Claims
Thu - Mar 26 - 10:30 - Natural Gas Inventories
Fri - Mar 27 - 08:30 - GDP
Fri - Mar 27 - 10:00 - Michigan Sentiment
This commentary is designed to stimulate thinking. This analysis is not a recommendation to buy, sell, hold or sell short any security (stock ETF or otherwise). We all need to think for ourselves when it comes to trading our own accounts. First, it is the only way to really learn. Second, we are the only ones responsible for our decisions. Think of these charts as food for further analysis. Before making a trade, it is important to have a plan. Plan the trade and trade the plan. Among other things, this includes setting a trigger level, a target area and a stop-loss level. It is also important to plan for three possible price movements: advance, decline or sideways. Have a plan for all three scenarios BEFORE making the trade. Consider possible holding times. And finally, look at overall market conditions and sector/industry performance.


