It was a very mixed week for stocks as QQQ lost around 2% and IWM gained 1.19%. Small-caps continue to lead in relative strength this year. A strong Dollar is helping the small-cap cause and hurting big multinationals. Renewed strength in the finance sector is also helping small-caps. Keep in mind that financials account for around 24% of the Russell 2000. The technology and energy sectors were hit with selling pressure last week, but healthcare and finance finished with gains. Healthcare, led by biotech, remains the strongest sector overall. Note that eight of the nine small-caps sector ETFs finished with gains last week. The SmallCap Energy ETF (PSCE) was the only one to lose ground.
**This chart analysis is for educational purposes only, and should not
be construed as a recommendation to buy, sell or sell-short said securities**
Short-term Overview (Monday, 16-March-2015):
- Breadth remains short-term bearish (since March 4th).
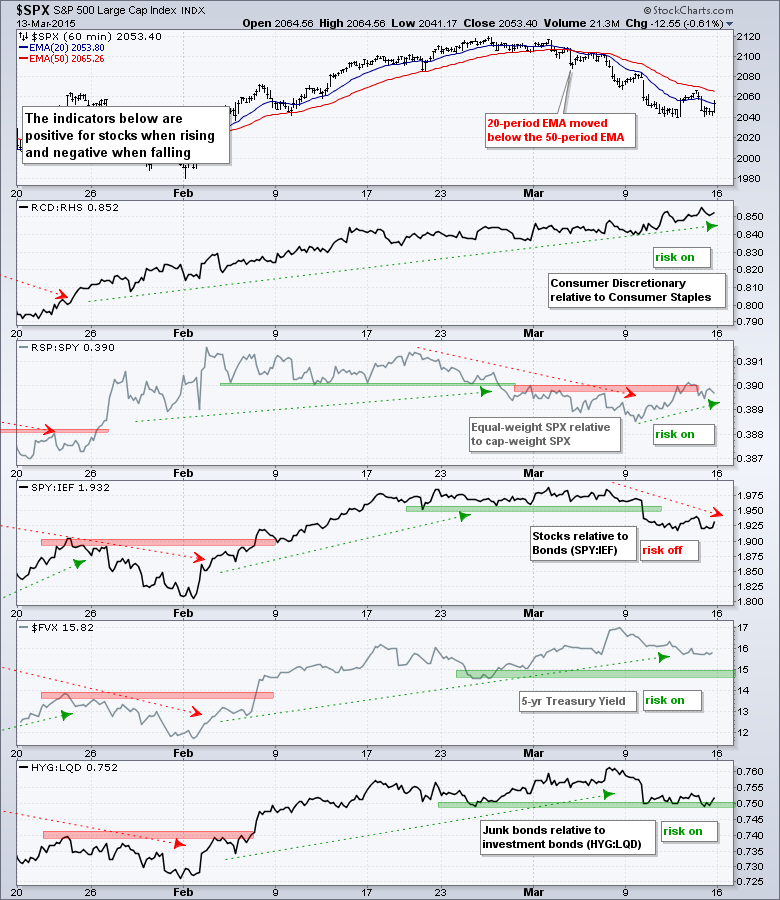
- Four of the five risk indicators are positive.
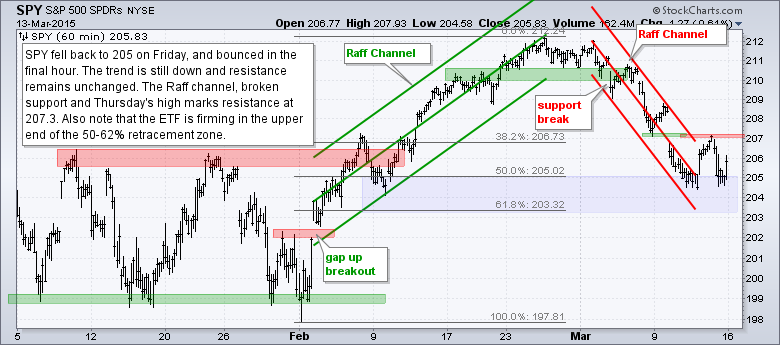
- SPY fell back on Friday to confirm short-term resistance (downtrend since March 4th)
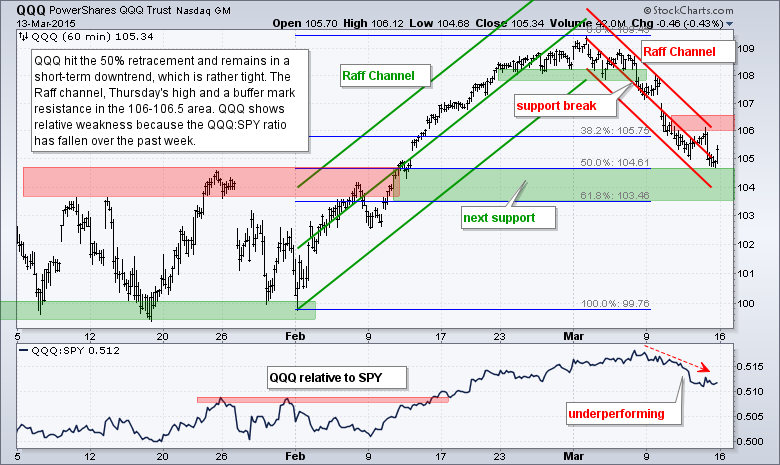
- QQQ remains in a tight downtrend and shows relative weakness (downtrend since March 6th).
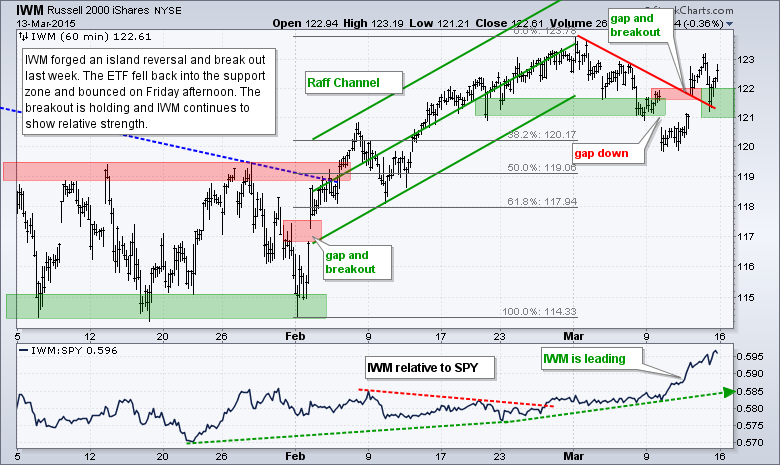
- IWM fell back on Friday, but held its gap and breakout (uptrend since March 12th).
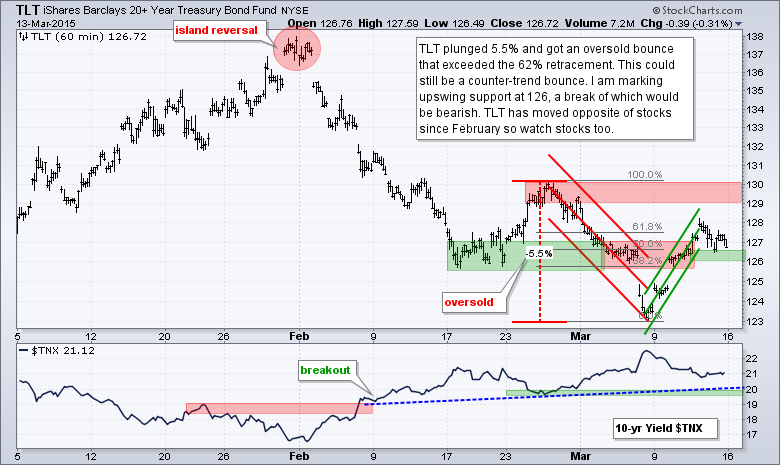
- TLT is hitting some resistance in the 50-62% retracement zone ahead of the Fed policy statement.
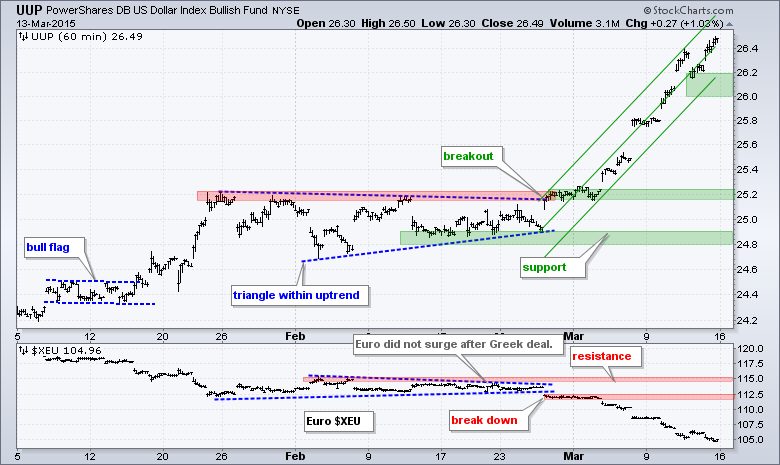
- UUP broke out of a triangle on 27-Feb and surged this month.
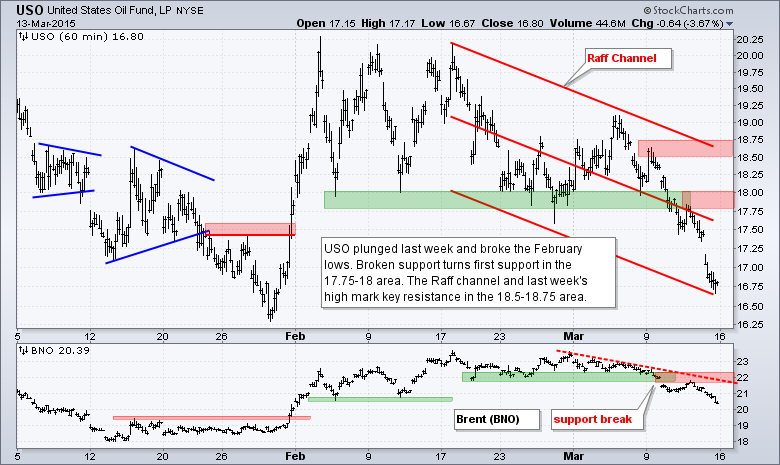
- USO remains in a downtrend defined by a Raff Regression Channel.
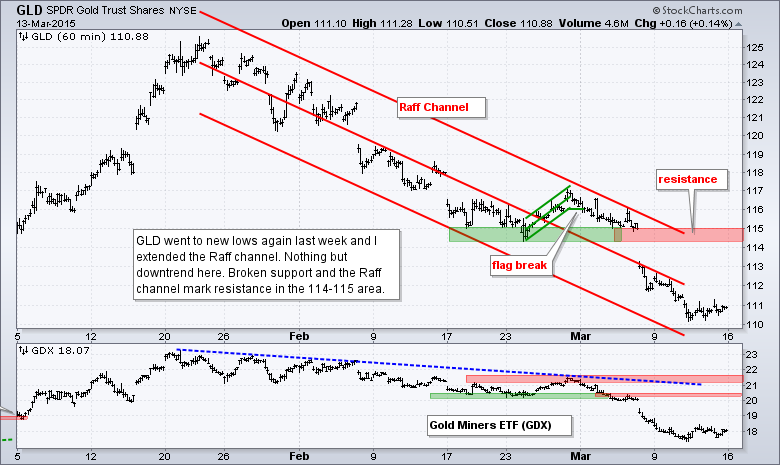
- GLD plunged to new lows again last week and has been in a downtrend since 29-Jan.
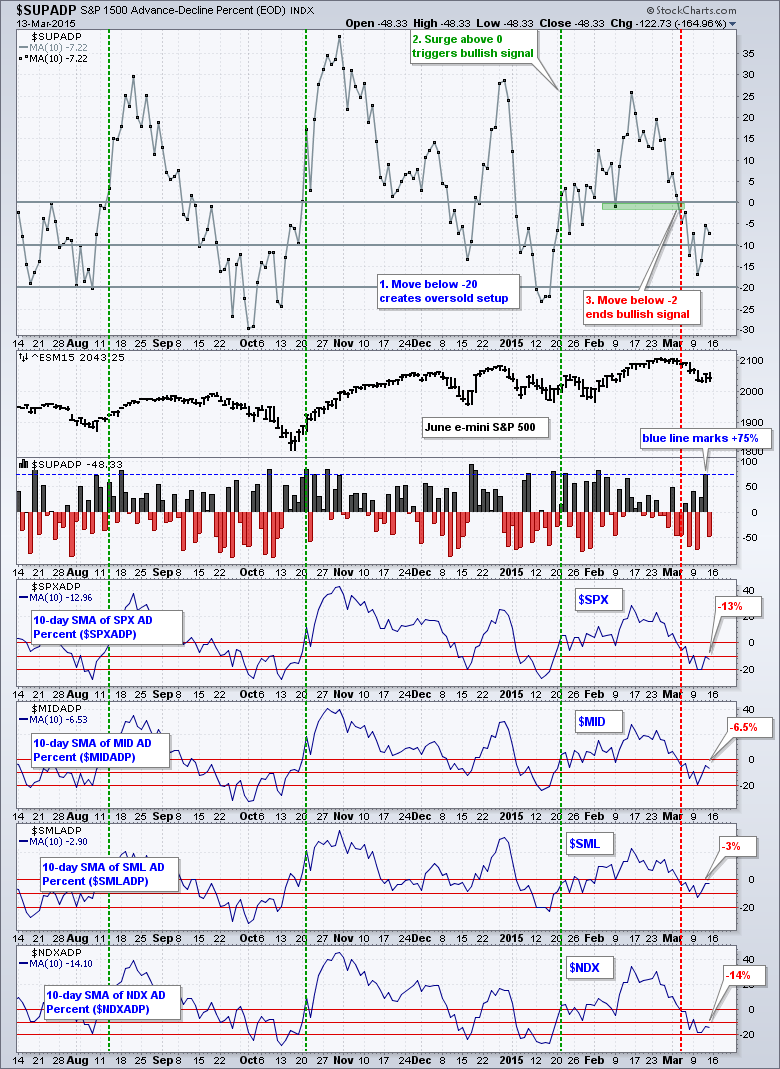
The 10-day SMA for S&P 1500 AD Percent ($SUPADP) bounced Wednesday-Thursday and then fell back a little on Friday. The indicator remains bearish overall and cannot be considered a positive force, literally and figuratively, until it breaks above zero. Small-cap breadth is the least weak (relative strength) because the 10-day SMA is near -3% and the closest to turning positive.
Four of the five risk indicators are positive, but still mixed and two could turn negative rather quickly. The RSP:SPY ratio bounced and edged above its early March high last week so I upgraded it to positive. Relative strength in the Equal-Weight S&P 500 ETF (RSP) fits with relative strength in small-caps. The HYG:LQD ratio fell back to the late February lows and stalled, but I remain positive on this risk indicator. A break below this support zone would be negative for High-Yield Bond ETF (HYG) and suggest risk aversion on the corporate bond market.
The evidence remains mixed for stocks. Breadth still favors the bears, but the risk indicators are net positive. IWM broke out and held this breakout, but SPY and QQQ remain in downtrends. The bigger trends are still up for IWM, SPY and QQQ, and these bigger uptrends can pull trump at any time.
**************************************************************
**************************************************************
**************************************************************
**************************************************************
**************************************************************
**************************************************************
***************************************************************
Key Reports and Events (all times Eastern):
Mon - Mar 16 - 08:30 - Empire State Manufacturing
Mon - Mar 16 - 09:15 - Industrial Production
Mon - Mar 16 - 10:00 - NAHB Housing Market Index
Tue - Mar 17 - 08:30 - Building Permits-Housing Starts
Wed - Mar 18 - 07:00 - MBA Mortgage Index
Wed - Mar 18 - 10:30 - Crude Oil Inventories
Wed - Mar 18 - 14:00 - FOMC Rate Decision
Thu - Mar 19 - 08:30 - Initial Jobless Claims
Thu - Mar 19 - 10:00 - Philadelphia Fed
Thu - Mar 19 - 10:00 - Leading Economic Indicators
Thu - Mar 19 - 10:30 - Natural Gas Inventories
Mon - Mar 23 - 10:00 - Existing Home Sales
Tue - Mar 24 - 08:30 - Consumer Price Index (CPI)
Tue - Mar 24 - 09:00 - FHFA Housing Price Index
Tue - Mar 24 - 10:00 - New Home Sales
Wed - Mar 25 - 07:00 - MBA Mortgage Index
Wed - Mar 25 - 08:30 - Durable Orders
Wed - Mar 25 - 10:30 - Crude Oil Inventories
Thu - Mar 26 - 08:30 - Initial Jobless Claims
Thu - Mar 26 - 10:30 - Natural Gas Inventories
Fri - Mar 27 - 08:30 - GDP
Fri - Mar 27 - 10:00 - Michigan Sentiment
This commentary is designed to stimulate thinking. This analysis is not a recommendation to buy, sell, hold or sell short any security (stock ETF or otherwise). We all need to think for ourselves when it comes to trading our own accounts. First, it is the only way to really learn. Second, we are the only ones responsible for our decisions. Think of these charts as food for further analysis. Before making a trade, it is important to have a plan. Plan the trade and trade the plan. Among other things, this includes setting a trigger level, a target area and a stop-loss level. It is also important to plan for three possible price movements: advance, decline or sideways. Have a plan for all three scenarios BEFORE making the trade. Consider possible holding times. And finally, look at overall market conditions and sector/industry performance.


