Stocks got their mojo back as the S&P 500 opened strong, stayed strong and finished at the high of the day. The large-cap indices led the move with 1+ percent gains. Small-caps lagged as IWM gained only .59%. Seven of the nine sectors were strong. Energy stocks were hit with another plunge in oil. The materials sector was hit with weakness in metals and mining. Semis led the tech sector higher as the Semiconductor SPDR (XSD) broke out of a small flag. Banks weighed on the market, and small-caps, as the Regional Bank SPDR (KRE) fell .19%. Biotechs continued their amazing run as the Biotech SPDR (XBI) surged another 1.5% and hit a new high.
**This chart analysis is for educational purposes only, and should not
be construed as a recommendation to buy, sell or sell-short said securities**
Short-term Overview (Tuesday, 17-March-2015):
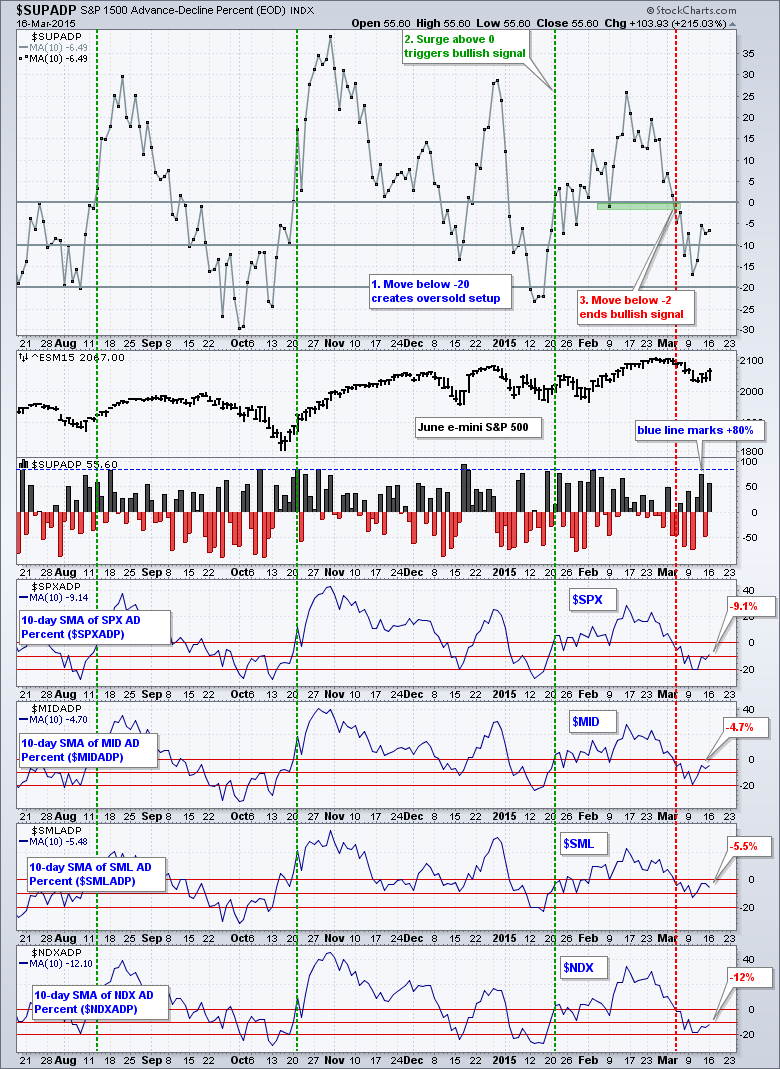
- Breadth remains short-term bearish (since March 4th).
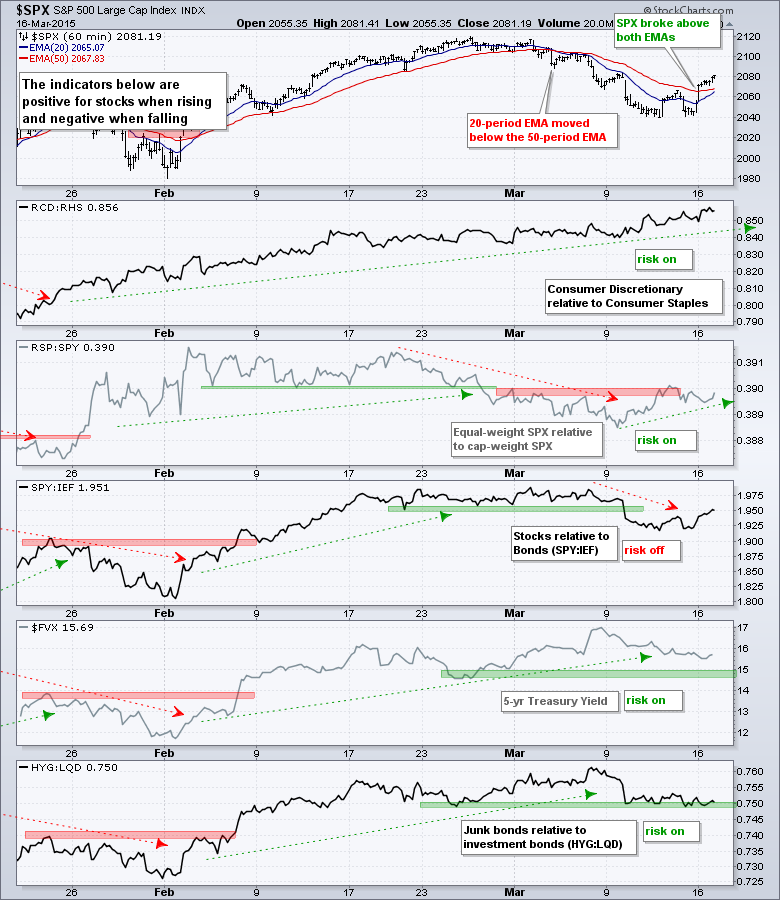
- Four of the five risk indicators are positive.
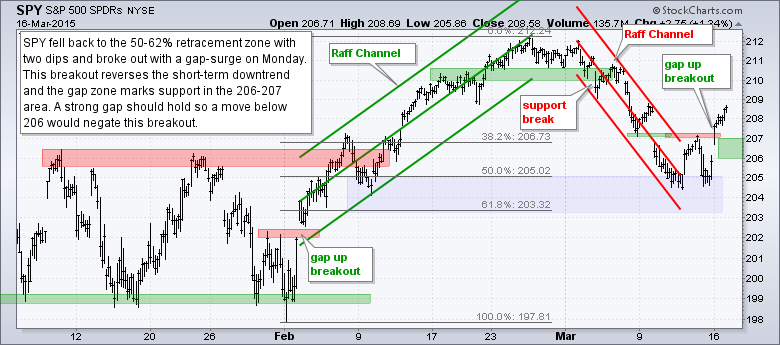
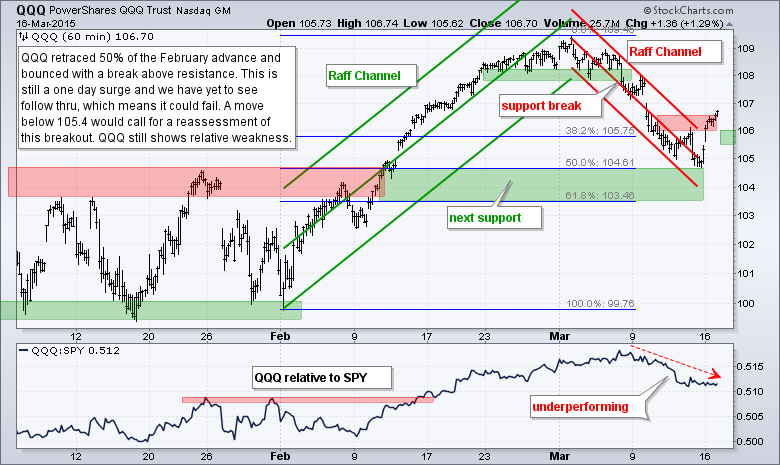
- SPY and QQQ reversed their short-term downtrends with breakouts on March 16th.
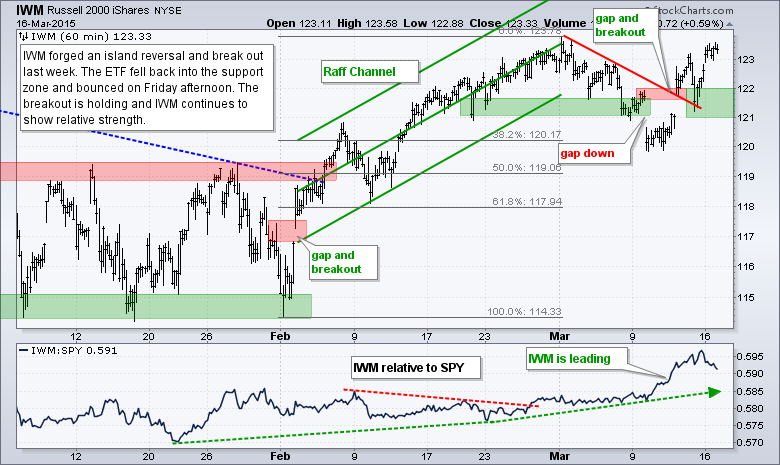
- IWM held last week's breakout and shows relative strength (uptrend since March 12th).
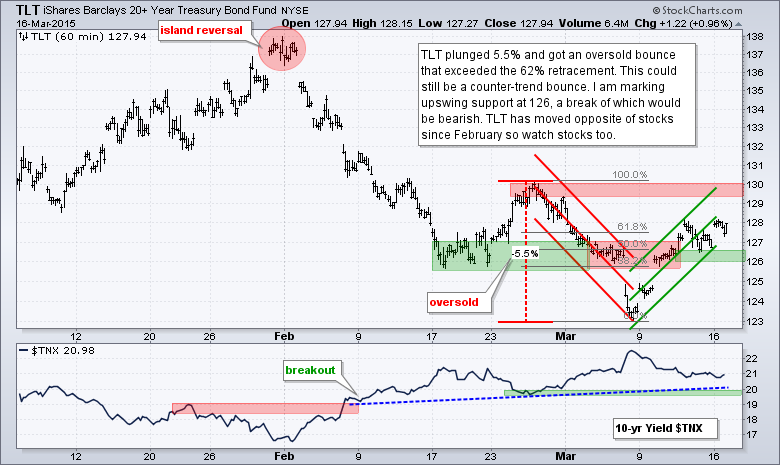
- TLT is hitting some resistance in the 50-62% retracement zone ahead of the Fed policy statement.
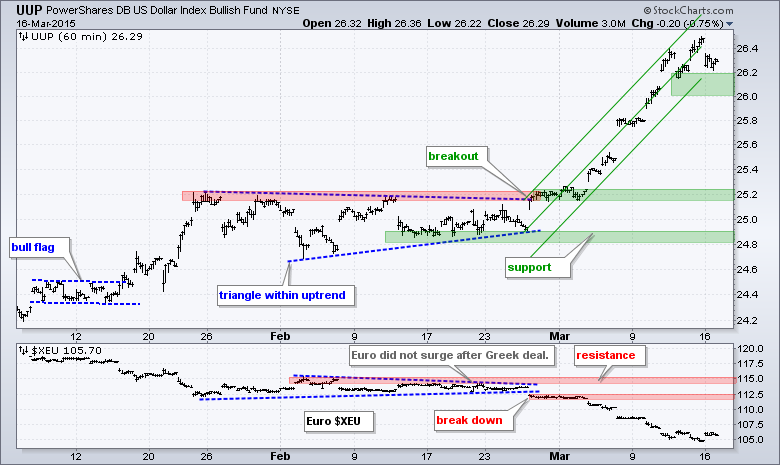
- UUP broke out of a triangle on 27-Feb and surged this month.
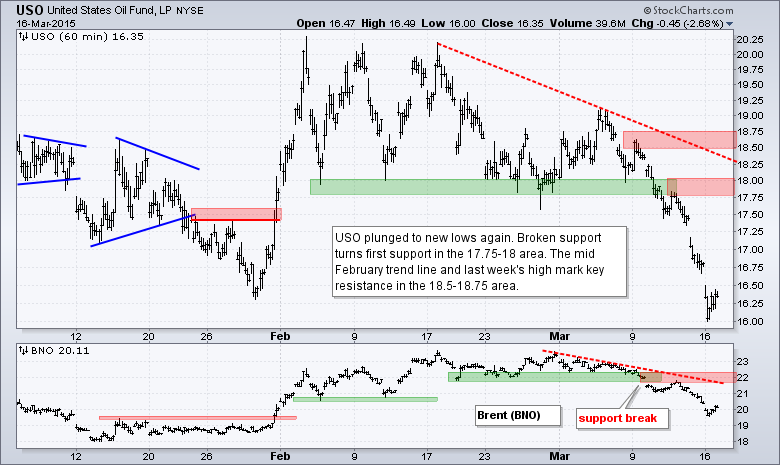
- USO fell to new lows and remains in a strong downtrend.
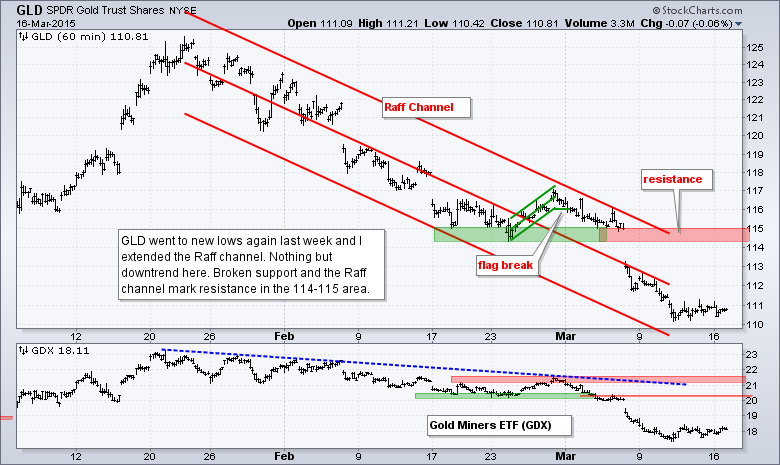
- GLD plunged to new lows again last week and has been in a downtrend since 29-Jan.
Stocks surged, but broad market breadth was not that strong because small-caps lagged. Go figure. Small-caps led last week and lagged on Monday. S&P 1500 AD Percent ($SUPADP) finished at +55% and did not exceed +80%, which would be required for a truly strong surge. The 10-day SMA remains below -5% and I still consider short-term breadth bearish as long as this indicator remains negative.
The risk indicators remain net positive for stocks. Consumer discretionary is outperforming consumer staples and short-term Treasuries are trending lower ($FVX is trending higher). The stock:bond ratio (SPY:IEF) turned up this week, but I am not quite ready to turn bullish on this indicator. It is a big week for Treasury bonds because the Fed makes its policy statement on Wednesday. This could be the make or break week for bonds.
The evidence now tilts towards the bulls, but it is not unanimous. SPY and QQQ joined IWM with breakouts on Monday. The breakout in SPY looks strong, but the breakout in QQQ is not as convincing and this large-cap ETF continues to lag. Breadth is also lagging a bit because the 10-day SMA for S&P 1500 AD Percent has yet to turn positive. We can expect some volatility the next two days because the Fed makes its policy statement on Wednesday afternoon.
**************************************************************
**************************************************************
**************************************************************
**************************************************************
**************************************************************
**************************************************************
***************************************************************
Key Reports and Events (all times Eastern):
Tue - Mar 17 - 08:30 - Building Permits-Housing Starts
Wed - Mar 18 - 07:00 - MBA Mortgage Index
Wed - Mar 18 - 10:30 - Crude Oil Inventories
Wed - Mar 18 - 14:00 - FOMC Rate Decision
Thu - Mar 19 - 08:30 - Initial Jobless Claims
Thu - Mar 19 - 10:00 - Philadelphia Fed
Thu - Mar 19 - 10:00 - Leading Economic Indicators
Thu - Mar 19 - 10:30 - Natural Gas Inventories
Mon - Mar 23 - 10:00 - Existing Home Sales
Tue - Mar 24 - 08:30 - Consumer Price Index (CPI)
Tue - Mar 24 - 09:00 - FHFA Housing Price Index
Tue - Mar 24 - 10:00 - New Home Sales
Wed - Mar 25 - 07:00 - MBA Mortgage Index
Wed - Mar 25 - 08:30 - Durable Orders
Wed - Mar 25 - 10:30 - Crude Oil Inventories
Thu - Mar 26 - 08:30 - Initial Jobless Claims
Thu - Mar 26 - 10:30 - Natural Gas Inventories
Fri - Mar 27 - 08:30 - GDP
Fri - Mar 27 - 10:00 - Michigan Sentiment
This commentary is designed to stimulate thinking. This analysis is not a recommendation to buy, sell, hold or sell short any security (stock ETF or otherwise). We all need to think for ourselves when it comes to trading our own accounts. First, it is the only way to really learn. Second, we are the only ones responsible for our decisions. Think of these charts as food for further analysis. Before making a trade, it is important to have a plan. Plan the trade and trade the plan. Among other things, this includes setting a trigger level, a target area and a stop-loss level. It is also important to plan for three possible price movements: advance, decline or sideways. Have a plan for all three scenarios BEFORE making the trade. Consider possible holding times. And finally, look at overall market conditions and sector/industry performance.


