Stocks were mixed on Tuesday with large-caps closing lower and small-caps edging higher. Eight of the nine sector SPDRs were down with materials falling 1.11%. Energy shares were also weak. The Home Construction iShares (ITB) fell after housing starts disappointed, but ITB remains in an uptrend overall. Gold fell to another new low for the move and this weighed on the Gold Miners ETF (GDX). Biotechs scored another gain and the Biotech SPDR (XBI) hit another new high. Weakness in oil could be filtering back into the junk bond market as the High Yield Bond SPDR (JNK) and High-Yield Bond ETF (HYG) fell around a half percent. These junk bond ETFs are down sharply in March. Note that the 20+ YR T-Bond ETF (TLT) is up sharply the last seven days and is seriously outperforming JNK, which points to some risk aversion on the bond market.
**This chart analysis is for educational purposes only, and should not
be construed as a recommendation to buy, sell or sell-short said securities**
Short-term Overview (Wednesday, 18-March-2015):
- Breadth remains short-term bearish (since March 4th).
- Four of the five risk indicators are positive.
- SPY and QQQ reversed their short-term downtrends with breakouts on March 16th.
- IWM held last week's breakout and shows relative strength (uptrend since March 12th).
- TLT is challenging a big resistance zone ahead of today's Fed statement.
- UUP broke out of a triangle on 27-Feb and surged this month.
- USO fell to new lows and remains in a strong downtrend.
- GLD plunged to new lows again this week and has been in a downtrend since 29-Jan.
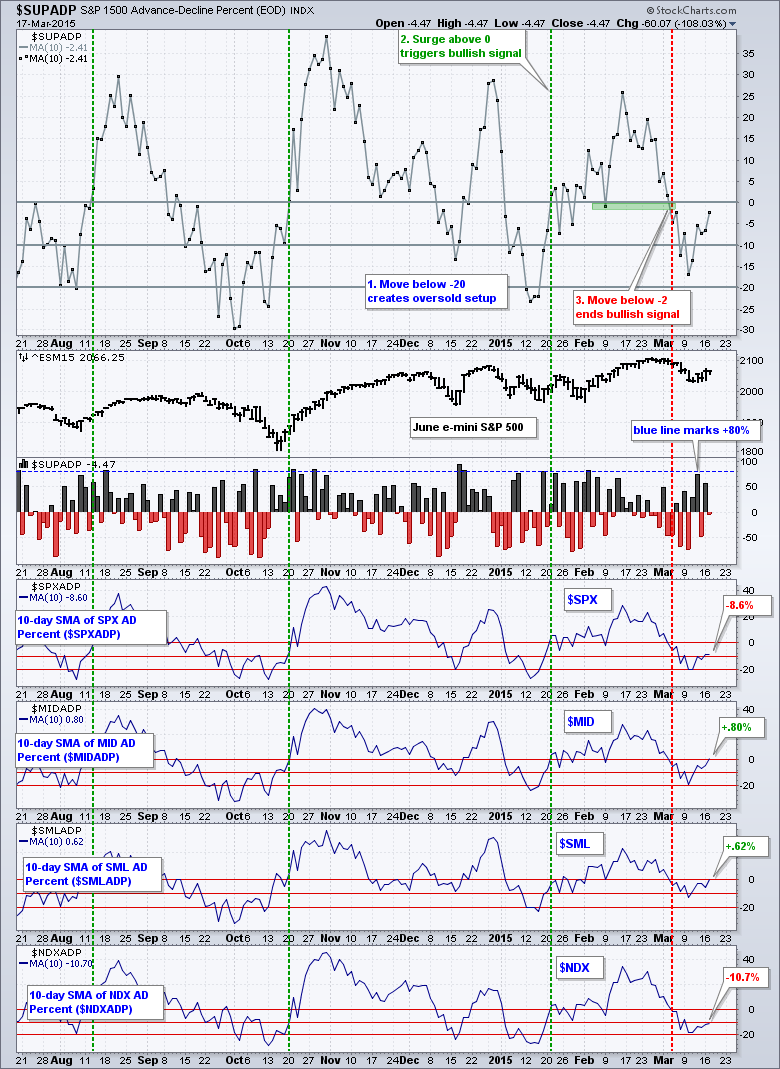
Short-term breadth was mixed on Tuesday and remains bearish overall (since March 4th). AD Percent finished positive for the S&P MidCap 400 and S&P Small-Cap 600, but negative for the S&P 500 and Nasdaq 100. Once again, we are seeing relative strength in small and mid caps. Also notice that the 10-day SMAs for AD Percent turned positive for $SML and $MID. Overall, the 10-day SMA for S&P 1500 AD Percent ($SUPADP) remains negative and needs to move into positive territory to turn, well, positive. It would also be nice to see an upward breadth thrust above +80% for AD Percent, which happened in mid October, mid December and early February.
The risk indicators remain net positive for stocks. Simply go down the right side of the chart and count the red (negative) versus the green (positive). On the 60-minute bar chart, $SPX broke above the two EMAs and the 20-period EMA crossed above the 50-period EMA (positive). Consumer discretionary is outperforming consumer staples (positive). The Equal-Weight S&P 500 ETF (RSP) has been outperforming the S&P 500 SPDR (SPY) the last seven days and is positive, but looks a bit shaky.

On the bond side, stocks have been underperforming bonds the last seven days (negative), but the 5-year Treasury Yield ($FVX) remains in an uptrend (positive). This means money is moving out of short-term Treasuries, which is positive for stocks. The High-Yield Bond ETF (HYG) is now underperforming the Investment Grade Bond ETF (LQD) and this suggests risk aversion in the bond market (negative). We can blame energy-related junk bond issuers for relative weakness in the junk bond ETF. This could spill over into the finance sector and affect stocks.
The evidence tilts towards the bulls, but it is not unanimous. SPY and QQQ joined IWM with breakouts on Monday. The breakout in SPY looks strong, but the breakout in QQQ is not as convincing and this large-cap ETF continues to lag. Breadth is also lagging a bit because the 10-day SMA for S&P 1500 AD Percent has yet to turn positive. We can expect some volatility today because the Fed makes its policy statement this afternoon.

**************************************************************

**************************************************************

**************************************************************

**************************************************************

**************************************************************

**************************************************************

***************************************************************
Key Reports and Events (all times Eastern):
Wed - Mar 18 - 07:00 - MBA Mortgage Index
Wed - Mar 18 - 10:30 - Crude Oil Inventories
Wed - Mar 18 - 14:00 - FOMC Rate Decision
Thu - Mar 19 - 08:30 - Initial Jobless Claims
Thu - Mar 19 - 10:00 - Philadelphia Fed
Thu - Mar 19 - 10:00 - Leading Economic Indicators
Thu - Mar 19 - 10:30 - Natural Gas Inventories
Mon - Mar 23 - 10:00 - Existing Home Sales
Tue - Mar 24 - 08:30 - Consumer Price Index (CPI)
Tue - Mar 24 - 09:00 - FHFA Housing Price Index
Tue - Mar 24 - 10:00 - New Home Sales
Wed - Mar 25 - 07:00 - MBA Mortgage Index
Wed - Mar 25 - 08:30 - Durable Orders
Wed - Mar 25 - 10:30 - Crude Oil Inventories
Thu - Mar 26 - 08:30 - Initial Jobless Claims
Thu - Mar 26 - 10:30 - Natural Gas Inventories
Fri - Mar 27 - 08:30 - GDP
Fri - Mar 27 - 10:00 - Michigan Sentiment
This commentary is designed to stimulate thinking. This analysis is not a recommendation to buy, sell, hold or sell short any security (stock ETF or otherwise). We all need to think for ourselves when it comes to trading our own accounts. First, it is the only way to really learn. Second, we are the only ones responsible for our decisions. Think of these charts as food for further analysis. Before making a trade, it is important to have a plan. Plan the trade and trade the plan. Among other things, this includes setting a trigger level, a target area and a stop-loss level. It is also important to plan for three possible price movements: advance, decline or sideways. Have a plan for all three scenarios BEFORE making the trade. Consider possible holding times. And finally, look at overall market conditions and sector/industry performance.
