Stocks were hit with broad selling pressure and fell sharply on Wednesday. QQQ and IWM led the way lower with 2+ percent declines. Eight of the nine sectors were down with techs leading the way. Energy stocks bucked the selling pressure as crude bounced. Techs were hit with heavy selling in the Semiconductor SPDR (-4.6%) and the Biotech SPDR (-5.4%). High-flying solar stocks were also hit hard as the Solar Energy ETF fell over 4%. One would expect money to move into bonds when stocks move sharply lower, but the 20+ YR T-Bond ETF (TLT) and Aggregate Bond ETF (AGG) sold off and closed lower on the day.
**This chart analysis is for educational purposes only, and should not
be construed as a recommendation to buy, sell or sell-short said securities**
Short-term Overview (Thursday, 26-March-2015):
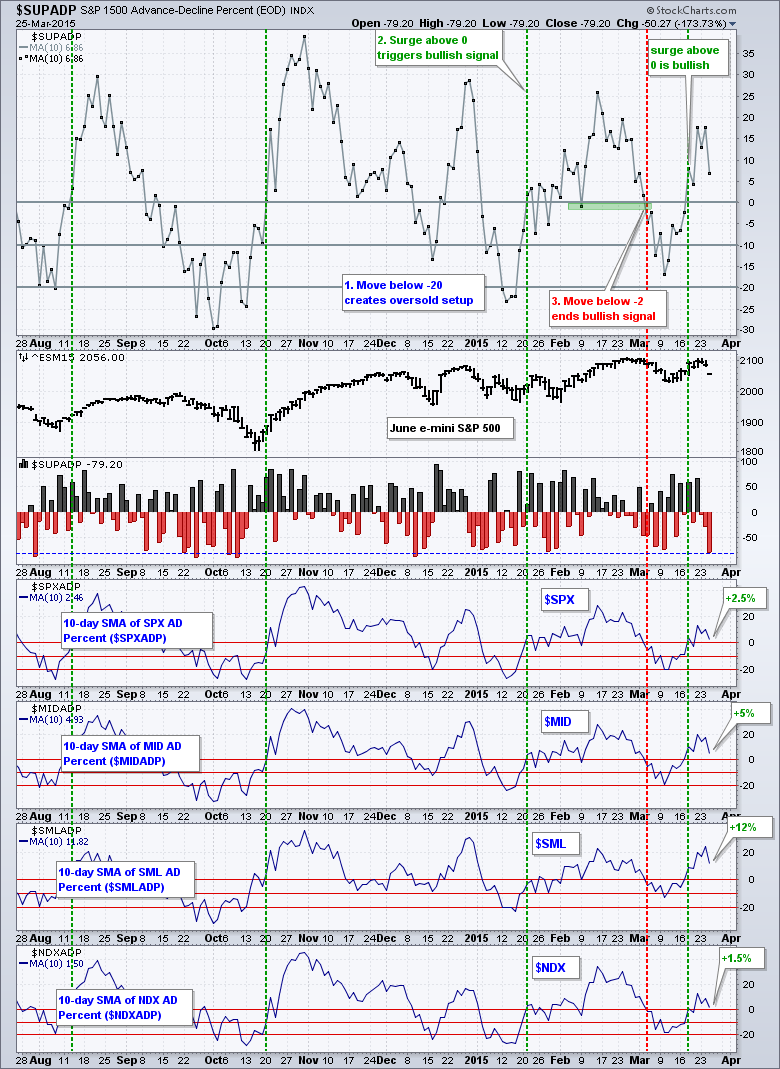
- Breadth took a big negative hit, but the 10-day SMA of AD Percent remains positive.
- Four of the five risk indicators are negative.
- SPY and QQQ broke support to reverse their short-term uptrends.
- IWM fell to support, but shows relative strength and has yet to break down.
- TLT remains in a steep uptrend.
- UUP fell sharply over the last few days, but is firming near the 62% retracement.
- USO bounced as the Dollar fell, but remains in a downtrend overall.
- GLD got a big bounce as the Dollar fell, but remains in a downtrend overall.
S&P 1500 AD Percent ($SUPADP) plunged to -79.2% and hit its lowest level since the second week of December. In other words, this was the most selling pressure seen in 2015. Nasdaq 100 AD Percent ($NDXADP) led the way with -94% and S&P SmallCap AD Percent ($SMLADP) finished at -81.3%.
The risk indicators are net negative (four negative and one positive). The RCD:RHS ratio plunged and broke down as consumer discretionary underperformed consumer staples. The Equal-Weight S&P 500 ETF (RSP) is still outperforming the S&P 500 SPDR (SPY) though.

The three bond-related indicators remain negative. The stock-related indicators are split. SPY is underperforming the 7-10 YR T-Bond ETF (IEF) and bonds have the relative edge. The 5-year Treasury Yield ($FVX) remains in a downtrend and this means money is moving into short-term Treasury bonds (safe havens). The HYG:LQD ratio flattened over the last five days, but remains in a downtrend overall.
The short-term evidence favors the bears. SPY and QQQ broke down with sharp declines. Even though the 10-day SMA of S&P 1500 AD Percent ($SUPADP) is still positive, Wednesday's breadth was the most negative of the year. Strength in bonds remains a concern because this shows a preference for safety over risk (stocks).

**************************************************************

**************************************************************

**************************************************************

**************************************************************

**************************************************************

**************************************************************

***************************************************************
Key Reports and Events (all times Eastern):
Thu - Mar 26 - 08:30 - Initial Jobless Claims
Thu - Mar 26 - 10:30 - Natural Gas Inventories
Fri - Mar 27 - 08:30 - GDP
Fri - Mar 27 - 10:00 - Michigan Sentiment
This commentary is designed to stimulate thinking. This analysis is not a recommendation to buy, sell, hold or sell short any security (stock ETF or otherwise). We all need to think for ourselves when it comes to trading our own accounts. First, it is the only way to really learn. Second, we are the only ones responsible for our decisions. Think of these charts as food for further analysis. Before making a trade, it is important to have a plan. Plan the trade and trade the plan. Among other things, this includes setting a trigger level, a target area and a stop-loss level. It is also important to plan for three possible price movements: advance, decline or sideways. Have a plan for all three scenarios BEFORE making the trade. Consider possible holding times. And finally, look at overall market conditions and sector/industry performance.
