I am on the road Thursday-Friday so this update will be brief. All the charts have been updated. For what it is worth, I am attending the MTA symposium in New York. The bulk of the short-term evidence turned bearish with Wednesday's decline and remains bearish. The bigger trend is up so this is still viewed as a correction within an uptrend.
**This chart analysis is for educational purposes only, and should not
be construed as a recommendation to buy, sell or sell-short said securities**
Short-term Overview (Friday, 27-March-2015):
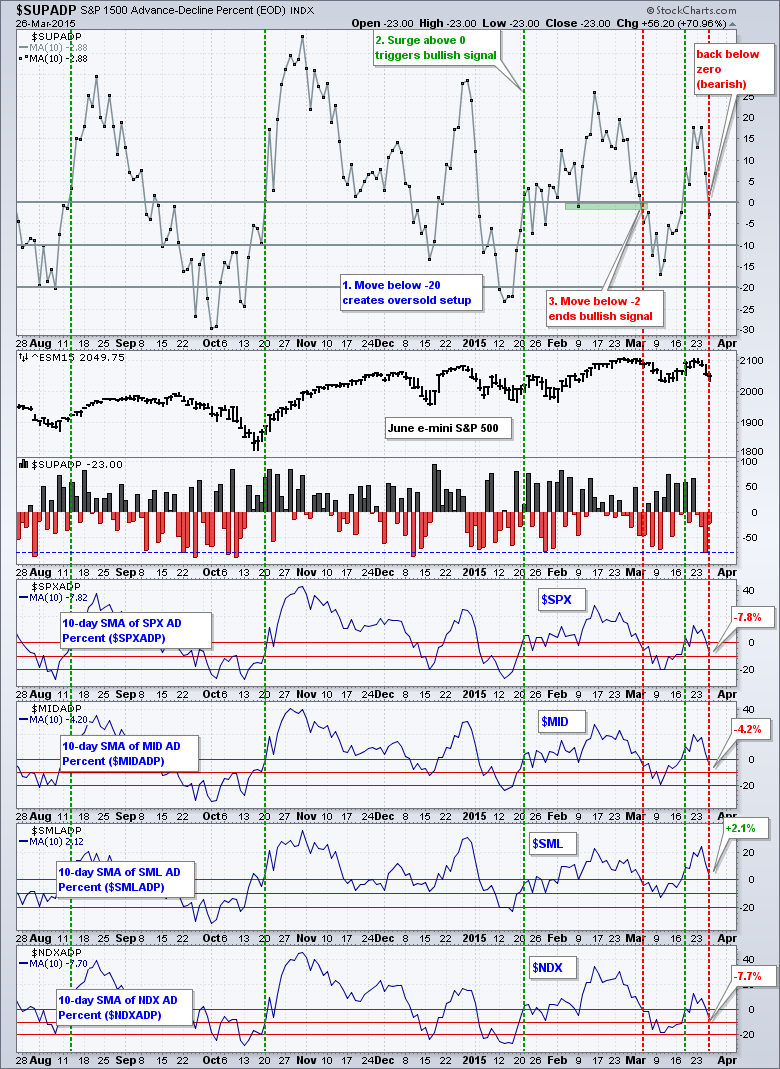
- The 10-day SMA for S&P 1500 AD Percent ($SUPADP) moved below zero to turn short-term bearish on March 26th.
- Four of the five risk indicators are negative.
- SPY and QQQ broke support to reverse their short-term uptrends on March 25th.
- IWM still shows relative strength, but broke support to reverse its short-term uptrend on March 26th.
- TLT hit its 62% retracement, fell back quite sharply and is testing support.
- UUP fell sharply over the last few days, but is firming near the 62% retracement.
- USO bounced to the 50-62% retracement zone.
- GLD also bounced and is trading near resistance from the 38% retracement and broken support.


**************************************************************

**************************************************************

**************************************************************

**************************************************************

**************************************************************

**************************************************************

***************************************************************
Key Reports and Events (all times Eastern):
Fri - Mar 27 - 08:30 - GDP
Fri - Mar 27 - 10:00 - Michigan Sentiment
This commentary is designed to stimulate thinking. This analysis is not a recommendation to buy, sell, hold or sell short any security (stock ETF or otherwise). We all need to think for ourselves when it comes to trading our own accounts. First, it is the only way to really learn. Second, we are the only ones responsible for our decisions. Think of these charts as food for further analysis. Before making a trade, it is important to have a plan. Plan the trade and trade the plan. Among other things, this includes setting a trigger level, a target area and a stop-loss level. It is also important to plan for three possible price movements: advance, decline or sideways. Have a plan for all three scenarios BEFORE making the trade. Consider possible holding times. And finally, look at overall market conditions and sector/industry performance.


