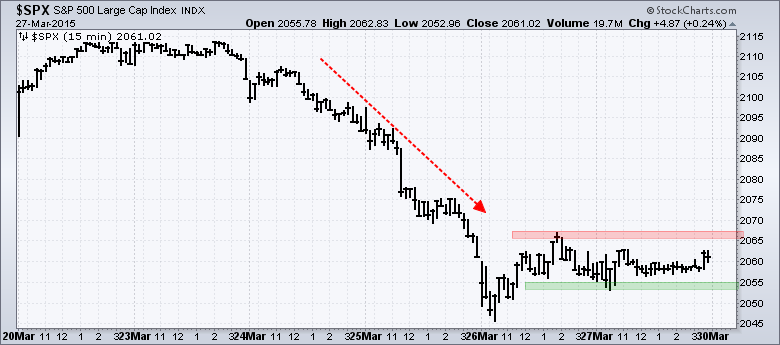
Stocks got slammed on Tuesday-Wednesday and firmed on Thursday-Friday. The S&P 500 fell from the 2110 area to the 2050 area and then moved into a rather tight trading range in the 2060 area. The resolution of this trading range could provide the next short-term signal. Either another shoe drops or the S&P 500 bounces off support from the mid March lows. Even though large-caps are lagging, I am encouraged with short-term strength in small-caps, the consumer discretionary sector, housing stocks and retail stocks. Semiconductors, which were pounded on Wednesday-Thursday, rebounded as the Semiconductor SPDR (XSD) surged over 3%.
**This chart analysis is for educational purposes only, and should not
be construed as a recommendation to buy, sell or sell-short said securities**
Short-term Overview (Monday, 30-March-2015):
- AD Percent was positive on Friday, but not very strong and remains weak overall.
- Four of the five risk indicators are negative.
- SPY and QQQ reversed their upswings with sharp declines last week, but ended the week near potential support zones.
- IWM also broke down, but shows relative strength and firmed in the 50-62% retracement zone.
- TLT reversed near the 62% retracement, but held support with a bounce on Friday.
- UUP corrected over the last few weeks and firmed near the 62% retracement.
- USO reversed in the 50-62% retracement zone with a sharp decline on Friday.
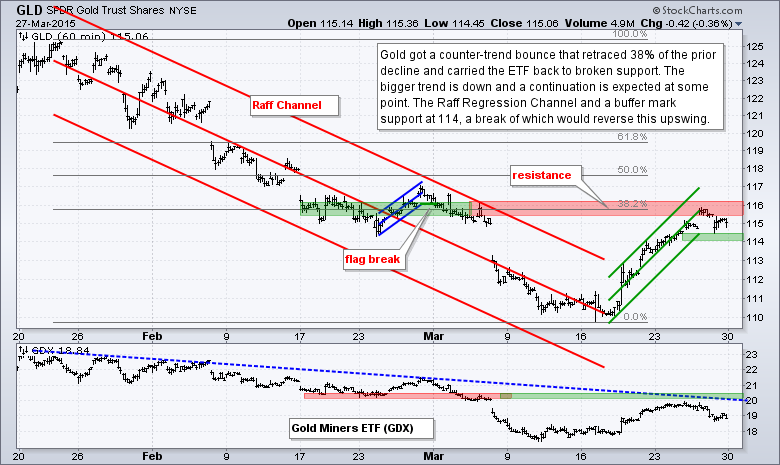
- GLD got a counter-trend bounce the last few weeks, but is near a resistance zone and key retracement.
Breadth is a tough call right now. The 10-day SMA for S&P 1500 AD Percent ($SUPADP) moved back above zero, but the range has narrowed over the last few weeks. In contrast to January-February, the 10-day SMA oscillated between +18% and -18% in March. Choppy trading could be the order of the day. The daily readings show a negative breadth thrust last week (< -70%) and this has yet to be countered with a positive breadth thrust (> +70%).

Four of the five risk indicators are negative. The RCD:RHS ratio turned negative last week because consumer discretionary has started underperforming consumer staples. This may just be a temporary pullback in relative performance, but it is still short-term negative for stocks. The RSP:SPY ratio, however, moved higher as the average stock in the S&P 500 outperformed the large-caps in the S&P 500. This ratio has been rising since March 9th. Overall, this means the stock-specific indicators are split.

The three bond-specific indicators are negative. Stocks have been underperforming bonds because the SPY:IEF ratio has been in a downtrend since early March. The 5-year Treasury Yield ($FVX) has been falling since March 8th as money moves into short-term Treasuries. The HYG:LQD ratio firmed last week, but remains in a downtrend since early March and this means junk bonds (riskier) are underperforming investment-grade bonds (safer).
The short-term evidence for stocks is mixed and it is a difficult call right now. SPY and QQQ are at support from the mid March lows and trading ranges could evolve. IWM shows relative strength and finished near a key retracement zone, which could produce a reversal. The bigger trends are up and could pull trump. It could be a most interesting week because several securities are at important levels that could trigger reversals.

**************************************************************

**************************************************************

**************************************************************

**************************************************************

**************************************************************

**************************************************************
***************************************************************
Key Reports and Events (all times Eastern):
Mon - Mar 30 - 08:30 - Personal Income & Spending
Mon - Mar 30 - 08:30 - PCE Prices
Mon - Mar 30 - 10:00 - Pending Home Sales
Tue - Mar 31 - 09:00 - Case-Shiller 20-city Index
Tue - Mar 31 - 09:45 - Chicago PMI
Tue - Mar 31 - 10:00 - Consumer Confidence
Wed - Apr 01 - 07:00 - MBA Mortgage Index
Wed - Apr 01 - 08:15 - ADP Employment Report
Wed - Apr 01 - 10:00 - ISM Manufacturing Index
Wed - Apr 01 - 10:00 - Construction Spending
Wed - Apr 01 - 10:30 - Oil Inventories
Wed - Apr 01 - 17:00 - Auto-Truck Sales
Thu - Apr 02 - 07:30 - Challenger Job
Thu - Apr 02 - 08:30 - Initial Jobless Claims
Thu - Apr 02 - 10:00 - Factory Orders
Thu - Apr 02 - 10:30 - Natural Gas Inventories
Fri - Apr 03 - 08:30 - Nonfarm Payrolls
Mon - Apr 06 - 10:00 - ISM Services Index
Tue - Apr 07 - 10:00 - JOLTS
Wed - Apr 08 - 07:00 - MBA Mortgage Index
Wed - Apr 08 - 10:30 - Oil Inventories
Wed - Apr 08 - 14:00 - FOMC Minutes
Thu - Apr 09 - 08:30 - Initial Jobless Claims
Thu - Apr 09 - 10:30 - Natural Gas Inventories
Tue - Apr 14 - 08:30 - Retail Sales
Tue - Apr 14 - 08:30 - Producer Price Index (PPI)
Wed - Apr 15 - 07:00 - MBA Mortgage Index
Wed - Apr 15 - 08:30 - Empire State Manufacturing
Wed - Apr 15 - 09:15 - Industrial Production
Wed - Apr 15 - 10:00 - NAHB Housing Market Index
Wed - Apr 15 - 10:30 - Oil Inventories
Wed - Apr 15 - 14:00 - Fed's Beige Book
Thu - Apr 16 - 08:30 - Initial Jobless Claims
Thu - Apr 16 - 08:30 - Housing Starts & Building Permits
Thu - Apr 16 - 10:00 - Philadelphia Fed
Thu - Apr 16 - 10:30 - Natural Gas Inventories
Fri - Apr 17 - 08:30 - Consumer Price Index (CPI)
Fri - Apr 17 - 10:00 - Michigan Sentiment
Fri - Apr 17 - 10:00 - Leading Economic Indicators
Wed - Apr 22 - 07:00 - MBA Mortgage Index
Wed - Apr 22 - 09:00 - FHFA Housing Price Index
Wed - Apr 22 - 10:00 - Existing Home Sales
Wed - Apr 22 - 10:30 - Oil Inventories
Thu - Apr 23 - 08:30 - Initial Jobless Claims
Thu - Apr 23 - 10:00 - New Home Sales
Thu - Apr 23 - 10:30 - Natural Gas Inventories
Fri - Apr 24 - 08:30 - Durable Goods Orders
Tue - Apr 28 - 09:00 - Case-Shiller Housing Index
Tue - Apr 28 - 10:00 - Consumer Confidence
Wed - Apr 29 - 07:00 - MBA Mortgage Purchase Index
Wed - Apr 29 - 10:00 - Pending Home Sales
Wed - Apr 29 - 10:30 - Oil Inventories
Wed - Apr 29 - 14:00 - FOMC Rate Decision
Thu - Apr 30 - 08:30 - Initial Jobless Claims
Thu - Apr 30 - 08:30 - PCE Prices
Thu - Apr 30 - 08:30 - Personal Income & Personal Spending
Thu - Apr 30 - 09:45 - Chicago PMI
Thu - Apr 30 - 10:30 - Natural Gas Inventories 0
Fri - May 01 - 08:15 - ADP Employment Report
Fri - May 01 - 10:00 - Construction Spending
Fri - May 01 - 10:00 - ISM Manufacturing Index
Fri - May 01 - 10:00 - Michigan Sentiment
Fri - May 01 - 17:00 - Auto-Truck Sales
This commentary is designed to stimulate thinking. This analysis is not a recommendation to buy, sell, hold or sell short any security (stock ETF or otherwise). We all need to think for ourselves when it comes to trading our own accounts. First, it is the only way to really learn. Second, we are the only ones responsible for our decisions. Think of these charts as food for further analysis. Before making a trade, it is important to have a plan. Plan the trade and trade the plan. Among other things, this includes setting a trigger level, a target area and a stop-loss level. It is also important to plan for three possible price movements: advance, decline or sideways. Have a plan for all three scenarios BEFORE making the trade. Consider possible holding times. And finally, look at overall market conditions and sector/industry performance.


