Stocks surged with a broad-based rally that lifted most boats. The major index ETFs were up over 1% with the Dow Diamonds (+1.46%) leading. All sector SPDRs were up over 1% with the Energy SPDR (+2.15%) leading. All small-caps sector ETFs were up with the SmallCap Consumer Staples ETF (+2.06%) and the SmallCap Materials ETF (+1.96%) leading. The Home Construction iShares (ITB) powered the consumer discretionary sector with a 1.69% gain and new high. Weakness in gold and silver weighed on the Gold Miners ETF (GDX) and Silver Miners ETF (SIL), which were the only two big losers.
**This chart analysis is for educational purposes only, and should not
be construed as a recommendation to buy, sell or sell-short said securities**
Short-term Overview (Tuesday, 31-March-2015):
- AD Percent surged above +70% on Monday and the 10-day SMA is back above +5%.
- Three of the five big sectors are in uptrends.
- SPY and QQQ are in trading ranges, but the swing within these ranges is up after Monday's surge.
- IWM held above the prior low and surged with a gap on Monday.
- TLT reversed near the 62% retracement, but held support with a bounce on Friday.
- UUP broke out with a gap and surge on Monday.
- USO hit the 50-62% retracement zone and reversed with a sharp decline on Friday.
- GLD reversed at broken support and the 38% retracement with a sharp decline on Monday.
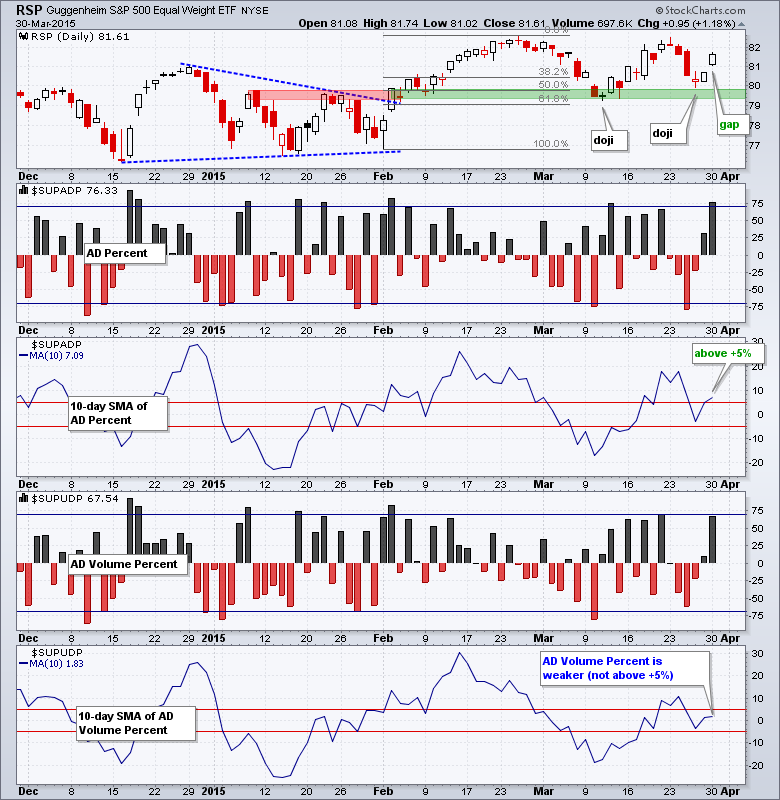
I am making a couple changes to the analysis outline. First, the breadth chart will now show the Equal-Weight S&P 500 ETF (RSP), S&P 1500 AD Percent ($SUPADP) and S&P 1500 AD Volume Percent ($SUPUDP). Second, the risk indicators will change to an overview of the top five equal-weight (EW) sectors, which account for over 70% of the S&P 500.
The Equal-Weight S&P 500 ETF (RSP) formed a doji at support on Thursday, bounced on Friday and surged with a gap on Monday. This reinforces support from the mid March lows. The gap is short-term bullish as long as it holds. S&P 1500 AD Percent ($SUPADP) surged above +70% on Monday and the 10-day SMA moved back above +5%. This indicator favors a short-term uptrend until it breaks below -5%, which is the bearish threshold. S&P 1500 AD Volume Percent ($SUPUDP) did not exceed +70% and the 10-day SMA remains below +5%. This moving average is still bullish overall because it broke above +5% on March 20th and has yet to counter with a move below -5%. We do not always get clear signals with these breadth indicators, but they can help define the path of least resistance for stocks.
Three of the five sectors are in clear uptrends with higher highs in early March and higher lows in late March (green trend lines). Consumer discretionary, finance and healthcare are the leaders right now. The Equal-weight Technology ETF (RYT) has been trending lower since early March with a lower high and lower low. The Equal-weight Industrials ETF (RGI) also formed a lower high and shows weakness. Both sector ETFs, however, surged on Monday and RGI showed good strength.

The short-term evidence favors the bulls. SPY and QQQ surged off support with gaps and the gaps held. IWM forged a higher low and also gapped up. While the gaps and surges are short-term bullish, there are still some negative undercurrents. AD Percent surged, but AD Volume Percent is lagging. The technology sector is also lagging. For now, the gaps are bullish until proven otherwise.

**************************************************************

**************************************************************

**************************************************************

**************************************************************

**************************************************************

**************************************************************

***************************************************************
Key Reports and Events (all times Eastern):
Tue - Mar 31 - 09:00 - Case-Shiller 20-city Index
Tue - Mar 31 - 09:45 - Chicago PMI
Tue - Mar 31 - 10:00 - Consumer Confidence
Wed - Apr 01 - 07:00 - MBA Mortgage Index
Wed - Apr 01 - 08:15 - ADP Employment Report
Wed - Apr 01 - 10:00 - ISM Manufacturing Index
Wed - Apr 01 - 10:00 - Construction Spending
Wed - Apr 01 - 10:30 - Oil Inventories
Wed - Apr 01 - 17:00 - Auto-Truck Sales
Thu - Apr 02 - 07:30 - Challenger Job
Thu - Apr 02 - 08:30 - Initial Jobless Claims
Thu - Apr 02 - 10:00 - Factory Orders
Thu - Apr 02 - 10:30 - Natural Gas Inventories
Fri - Apr 03 - 08:30 - Nonfarm Payrolls
Mon - Apr 06 - 10:00 - ISM Services Index
Tue - Apr 07 - 10:00 - JOLTS
Wed - Apr 08 - 07:00 - MBA Mortgage Index
Wed - Apr 08 - 10:30 - Oil Inventories
Wed - Apr 08 - 14:00 - FOMC Minutes
Thu - Apr 09 - 08:30 - Initial Jobless Claims
Thu - Apr 09 - 10:30 - Natural Gas Inventories
Tue - Apr 14 - 08:30 - Retail Sales
Tue - Apr 14 - 08:30 - Producer Price Index (PPI)
Wed - Apr 15 - 07:00 - MBA Mortgage Index
Wed - Apr 15 - 08:30 - Empire State Manufacturing
Wed - Apr 15 - 09:15 - Industrial Production
Wed - Apr 15 - 10:00 - NAHB Housing Market Index
Wed - Apr 15 - 10:30 - Oil Inventories
Wed - Apr 15 - 14:00 - Fed's Beige Book
Thu - Apr 16 - 08:30 - Initial Jobless Claims
Thu - Apr 16 - 08:30 - Housing Starts & Building Permits
Thu - Apr 16 - 10:00 - Philadelphia Fed
Thu - Apr 16 - 10:30 - Natural Gas Inventories
Fri - Apr 17 - 08:30 - Consumer Price Index (CPI)
Fri - Apr 17 - 10:00 - Michigan Sentiment
Fri - Apr 17 - 10:00 - Leading Economic Indicators
Wed - Apr 22 - 07:00 - MBA Mortgage Index
Wed - Apr 22 - 09:00 - FHFA Housing Price Index
Wed - Apr 22 - 10:00 - Existing Home Sales
Wed - Apr 22 - 10:30 - Oil Inventories
Thu - Apr 23 - 08:30 - Initial Jobless Claims
Thu - Apr 23 - 10:00 - New Home Sales
Thu - Apr 23 - 10:30 - Natural Gas Inventories
Fri - Apr 24 - 08:30 - Durable Goods Orders
Tue - Apr 28 - 09:00 - Case-Shiller Housing Index
Tue - Apr 28 - 10:00 - Consumer Confidence
Wed - Apr 29 - 07:00 - MBA Mortgage Purchase Index
Wed - Apr 29 - 10:00 - Pending Home Sales
Wed - Apr 29 - 10:30 - Oil Inventories
Wed - Apr 29 - 14:00 - FOMC Rate Decision
Thu - Apr 30 - 08:30 - Initial Jobless Claims
Thu - Apr 30 - 08:30 - PCE Prices
Thu - Apr 30 - 08:30 - Personal Income & Personal Spending
Thu - Apr 30 - 09:45 - Chicago PMI
Thu - Apr 30 - 10:30 - Natural Gas Inventories 0
Fri - May 01 - 08:15 - ADP Employment Report
Fri - May 01 - 10:00 - Construction Spending
Fri - May 01 - 10:00 - ISM Manufacturing Index
Fri - May 01 - 10:00 - Michigan Sentiment
Fri - May 01 - 17:00 - Auto-Truck Sales
This commentary is designed to stimulate thinking. This analysis is not a recommendation to buy, sell, hold or sell short any security (stock ETF or otherwise). We all need to think for ourselves when it comes to trading our own accounts. First, it is the only way to really learn. Second, we are the only ones responsible for our decisions. Think of these charts as food for further analysis. Before making a trade, it is important to have a plan. Plan the trade and trade the plan. Among other things, this includes setting a trigger level, a target area and a stop-loss level. It is also important to plan for three possible price movements: advance, decline or sideways. Have a plan for all three scenarios BEFORE making the trade. Consider possible holding times. And finally, look at overall market conditions and sector/industry performance.


