Stocks were mostly lower on Tuesday. The S&P 500 opened lower, stalled for a few hours and then moved lower again in the final hour. Large-caps led the way, while small-caps fell fractionally and showed relative strength again. Eight of the nine sector SPDRs were down with the HealthCare SPDR (XLV) losing the most (-1.73%). Weakness in biotechs weighed as the Biotech iShares (IBB) fell around 2%. The Utilities SPDR (XLU) was the lone gainer and the Consumer Discretionary SPDR (XLY) showed relative strength with the smallest loss. Utilities will be in the spotlight this week because they are positively correlated to the 20+ YR T-Bond ETF (TLT) and bonds could make a move this week (employment indicators).
**This chart analysis is for educational purposes only, and should not
be construed as a recommendation to buy, sell or sell-short said securities**
Short-term Overview (Wednesday, 1-April-2015):
- Breadth is split with AD Percent slightly positive and AD Volume Percent slightly negative.
- Three of the five big sectors are in downtrends.
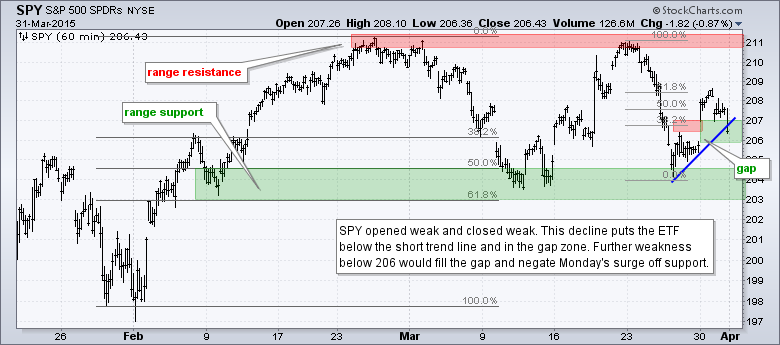
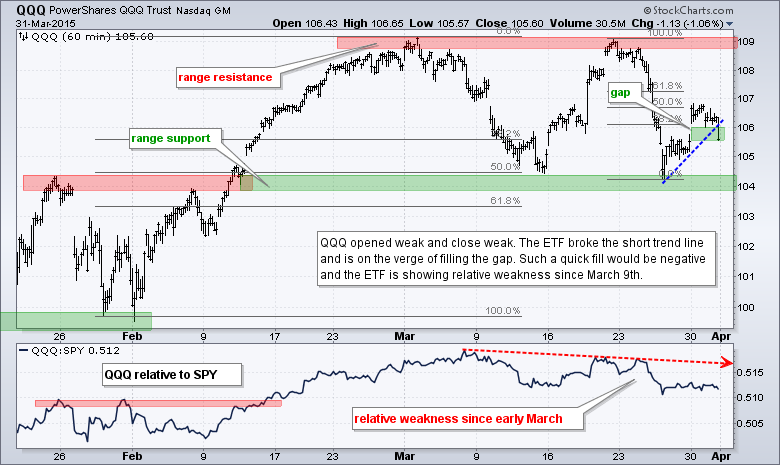
- SPY and QQQ are in short-term uptrends, but moved back into their gap zones.
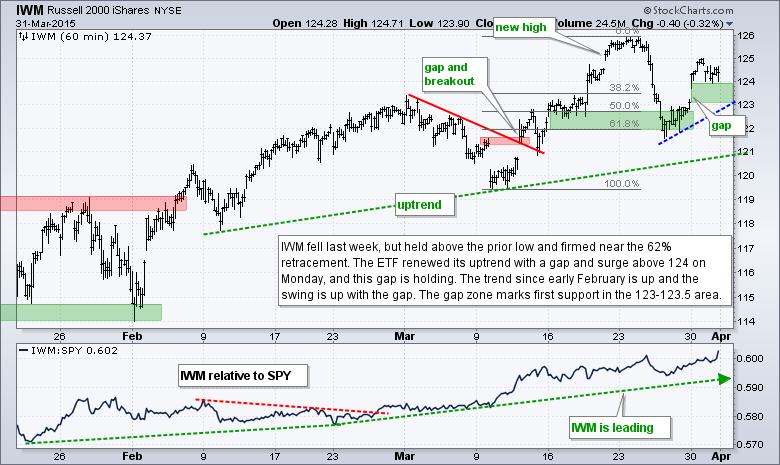
- IWM held above its gap zone and shows relative strength.
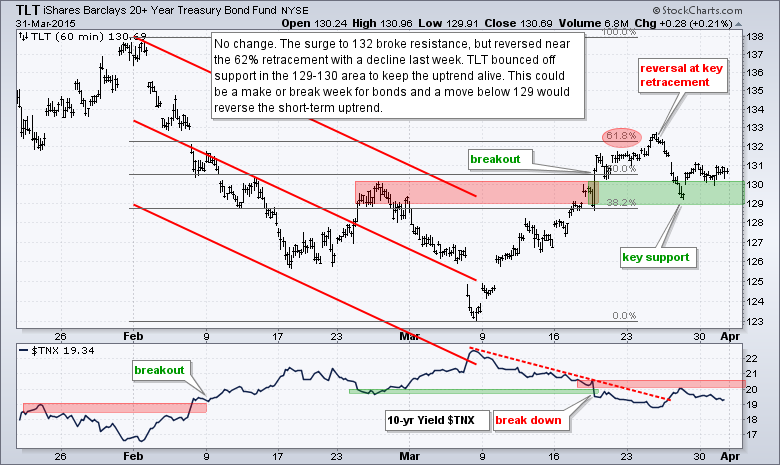
- TLT reversed near the 62% retracement last week, but held support with a bounce on Friday.
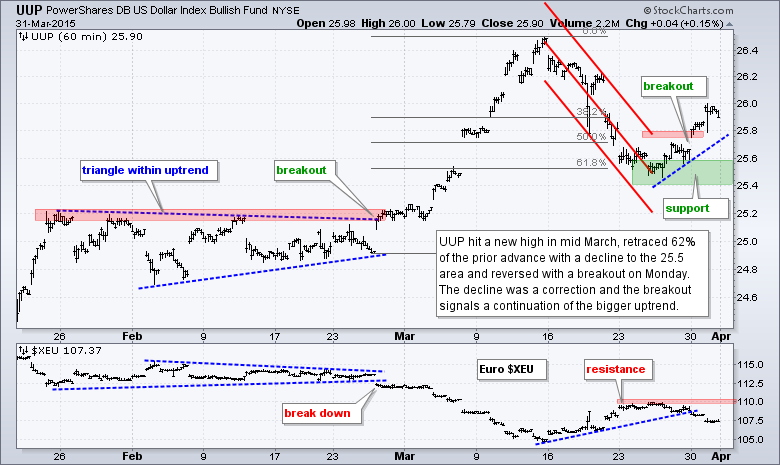
- UUP broke out with a gap and surge on Monday.
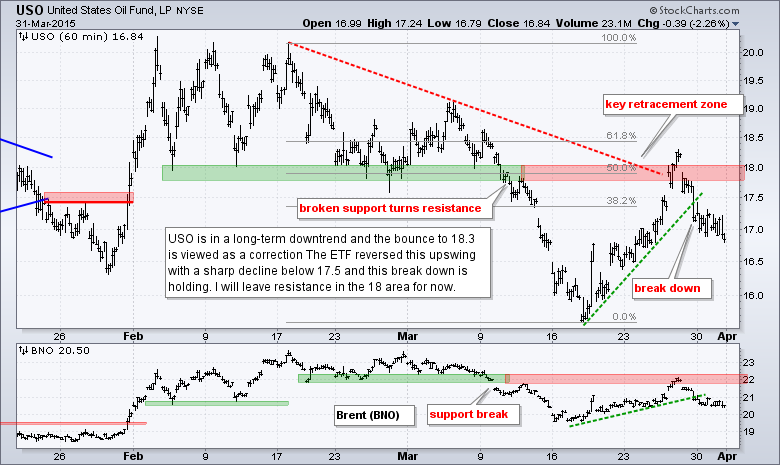
- USO hit the 50-62% retracement zone and reversed with a sharp decline on Friday.
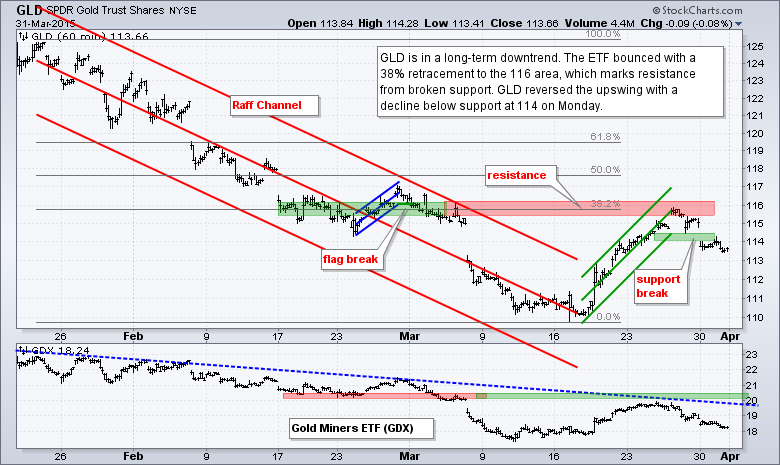
- GLD reversed at broken support and the 38% retracement with a sharp decline on Monday.
I decided to watch the five key sectors instead of the risk indicators because the sectors are part of the stock market. Bonds are not. The whole is only as good as the sum of the parts and the sectors form the key parts of the stock market. Bonds sometimes march to the beat of a different drummer and have a fuzzy relationship with the stock market.
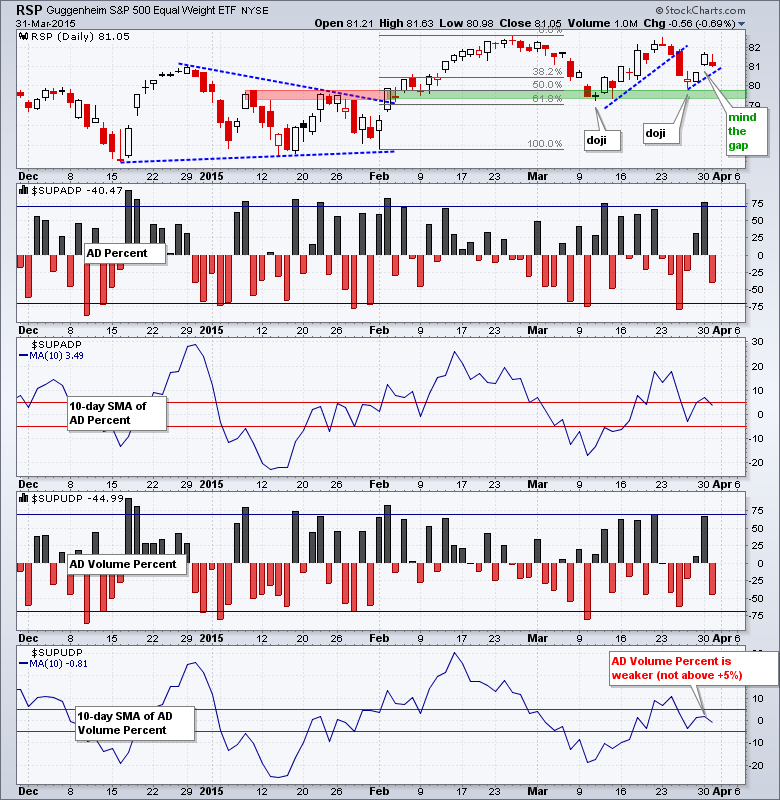
The Equal-Weight S&P 500 ETF (RSP) closed weak, but is still holding the gap. A close below 80.5 would fill the gap and call for a reassessment. Breadth is still a tough call right now. The 10-day SMA for S&P 1500 AD Percent ($SUPADP) is barely positive and the 10-day SMA for S&P 1500 AD Volume Percent ($SUPUDP) is slightly negative. We are seeing relative weakness in AD Volume Percent because large-caps are underperforming. A move below -5% in the 10-day SMAs would be bearish for breadth.
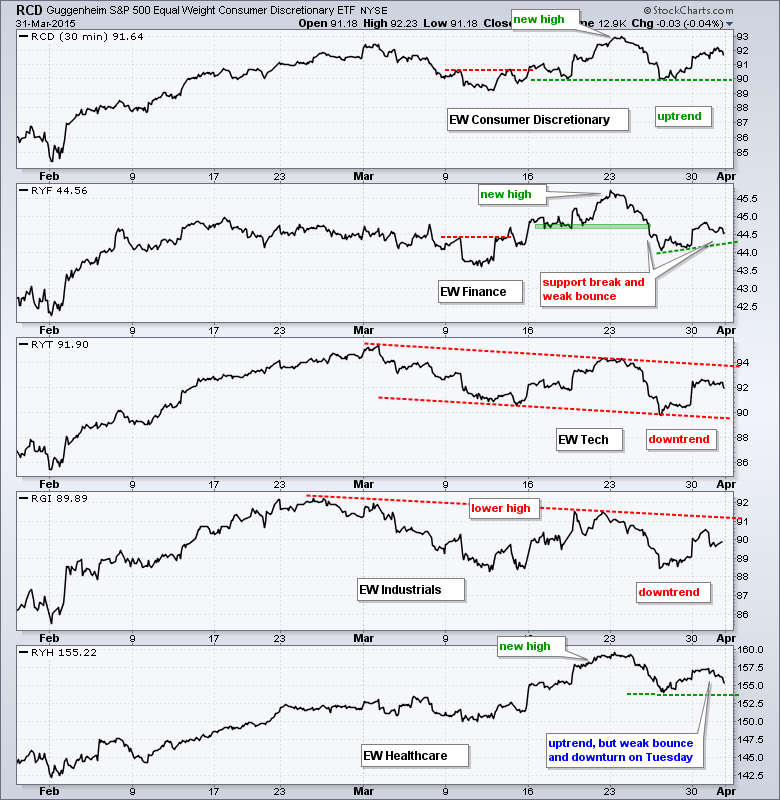
The Equal-Weight Consumer Discretionary ETF (RCD) is the strongest of the top five sectors because it held the lows from 17-18 March and bounced the last four days. In contrast to RCD, the Equal-weight Finance ETF (RYF) broke corresponding lows and the bounce over the last few days was quite weak. The Equal-weight Technology ETF (RYT) remains in a short-term downtrend, as does the Equal-weight Industrials ETF (RGI). The Equal-weight Healthcare ETF (RYH) is in an uptrend, but may be forming a lower high after Tuesday's rather sharp downtrend. All told: I count two in short-term uptrends (RCD, RYH) and three in short-term downtrends (RYF, RYT, RGI). RYF could still go either way so I will be watching it closely.
The short-term evidence favors the bulls, but the market is looking a little shaky. SPY and QQQ closed weak and moved into their gap zones. IWM shows relative strength by holding firmly above the gap. Small-caps are the place to be, especially with the Dollar strengthening again. The breadth indicators are mixed and the sector trends are also mixed. Trading could turn volatile the next two days as we head into the employment report.
**************************************************************
**************************************************************
**************************************************************
**************************************************************
**************************************************************
**************************************************************
***************************************************************
Key Reports and Events (all times Eastern):
Wed - Apr 01 - 07:00 - MBA Mortgage Index
Wed - Apr 01 - 08:15 - ADP Employment Report
Wed - Apr 01 - 10:00 - ISM Manufacturing Index
Wed - Apr 01 - 10:00 - Construction Spending
Wed - Apr 01 - 10:30 - Oil Inventories
Wed - Apr 01 - 17:00 - Auto-Truck Sales
Thu - Apr 02 - 07:30 - Challenger Job
Thu - Apr 02 - 08:30 - Initial Jobless Claims
Thu - Apr 02 - 10:00 - Factory Orders
Thu - Apr 02 - 10:30 - Natural Gas Inventories
Fri - Apr 03 - 08:30 - Nonfarm Payrolls
Mon - Apr 06 - 10:00 - ISM Services Index
Tue - Apr 07 - 10:00 - JOLTS
Wed - Apr 08 - 07:00 - MBA Mortgage Index
Wed - Apr 08 - 10:30 - Oil Inventories
Wed - Apr 08 - 14:00 - FOMC Minutes
Thu - Apr 09 - 08:30 - Initial Jobless Claims
Thu - Apr 09 - 10:30 - Natural Gas Inventories
Tue - Apr 14 - 08:30 - Retail Sales
Tue - Apr 14 - 08:30 - Producer Price Index (PPI)
Wed - Apr 15 - 07:00 - MBA Mortgage Index
Wed - Apr 15 - 08:30 - Empire State Manufacturing
Wed - Apr 15 - 09:15 - Industrial Production
Wed - Apr 15 - 10:00 - NAHB Housing Market Index
Wed - Apr 15 - 10:30 - Oil Inventories
Wed - Apr 15 - 14:00 - Fed's Beige Book
Thu - Apr 16 - 08:30 - Initial Jobless Claims
Thu - Apr 16 - 08:30 - Housing Starts & Building Permits
Thu - Apr 16 - 10:00 - Philadelphia Fed
Thu - Apr 16 - 10:30 - Natural Gas Inventories
Fri - Apr 17 - 08:30 - Consumer Price Index (CPI)
Fri - Apr 17 - 10:00 - Michigan Sentiment
Fri - Apr 17 - 10:00 - Leading Economic Indicators
Wed - Apr 22 - 07:00 - MBA Mortgage Index
Wed - Apr 22 - 09:00 - FHFA Housing Price Index
Wed - Apr 22 - 10:00 - Existing Home Sales
Wed - Apr 22 - 10:30 - Oil Inventories
Thu - Apr 23 - 08:30 - Initial Jobless Claims
Thu - Apr 23 - 10:00 - New Home Sales
Thu - Apr 23 - 10:30 - Natural Gas Inventories
Fri - Apr 24 - 08:30 - Durable Goods Orders
Tue - Apr 28 - 09:00 - Case-Shiller Housing Index
Tue - Apr 28 - 10:00 - Consumer Confidence
Wed - Apr 29 - 07:00 - MBA Mortgage Purchase Index
Wed - Apr 29 - 10:00 - Pending Home Sales
Wed - Apr 29 - 10:30 - Oil Inventories
Wed - Apr 29 - 14:00 - FOMC Rate Decision
Thu - Apr 30 - 08:30 - Initial Jobless Claims
Thu - Apr 30 - 08:30 - PCE Prices
Thu - Apr 30 - 08:30 - Personal Income & Personal Spending
Thu - Apr 30 - 09:45 - Chicago PMI
Thu - Apr 30 - 10:30 - Natural Gas Inventories
Fri - May 01 - 08:15 - ADP Employment Report
Fri - May 01 - 10:00 - Construction Spending
Fri - May 01 - 10:00 - ISM Manufacturing Index
Fri - May 01 - 10:00 - Michigan Sentiment
Fri - May 01 - 17:00 - Auto-Truck Sales
This commentary is designed to stimulate thinking. This analysis is not a recommendation to buy, sell, hold or sell short any security (stock ETF or otherwise). We all need to think for ourselves when it comes to trading our own accounts. First, it is the only way to really learn. Second, we are the only ones responsible for our decisions. Think of these charts as food for further analysis. Before making a trade, it is important to have a plan. Plan the trade and trade the plan. Among other things, this includes setting a trigger level, a target area and a stop-loss level. It is also important to plan for three possible price movements: advance, decline or sideways. Have a plan for all three scenarios BEFORE making the trade. Consider possible holding times. And finally, look at overall market conditions and sector/industry performance.


