Stocks continued higher with the S&P 500 and Dow Industrials recording new all time highs. They were not the leaders though. The Russell 2000 iShares (IWM) led and was the only major index ETF to gain over 1% on the day. Seven of the nine sector SPDRs finished higher. Materials and consumer staples were the two losers. The consumer discretionary showed some upside leadership with nice gains in the Home Construction iShares (+.86%) and the Retail SPDR (+.98%). Techs were also strong with good gains coming from the Semiconductor SPDR (+1.79%) and the Networking iShares (+.97%). IGN hit a new high and XSD broke out of a triangle formation. The finance sector also led as the Regional Bank SPDR (KRE) and the Broker-Dealer iShares (IAI) gained around 1.5%.
**This chart analysis is for educational purposes only, and should not
be construed as a recommendation to buy, sell or sell-short said securities**
Short-term Overview (Tuesday, 19-May-2015):
- Short-term breadth indicators are bullish.
- All five equal-weight sectors are in uptrends.
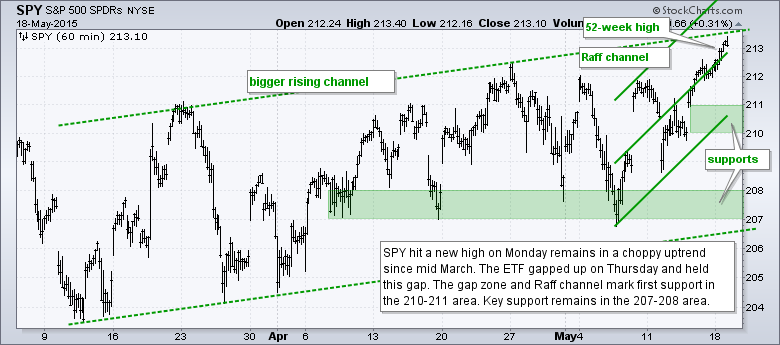
- SPY hit a new high and remains in a choppy uptrend.
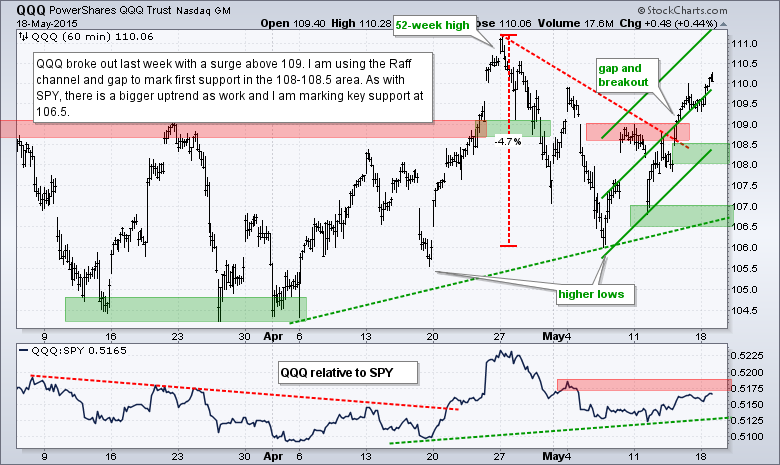
- QQQ broke out last week and remains in an uptrend.
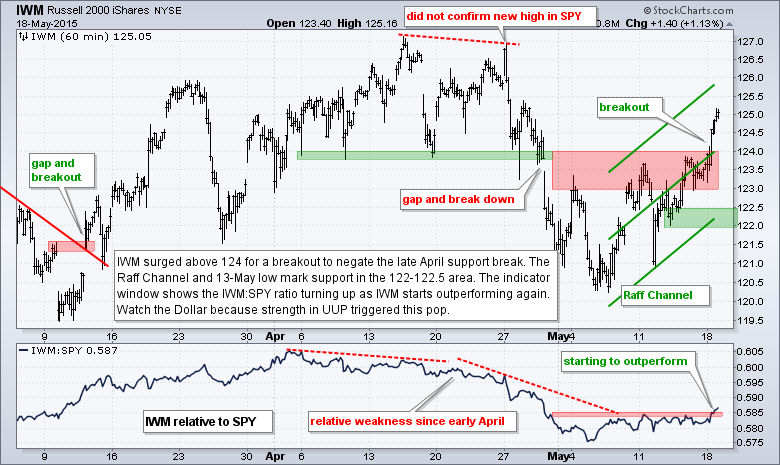
- IWM broke out and is now in a short-term uptrend.
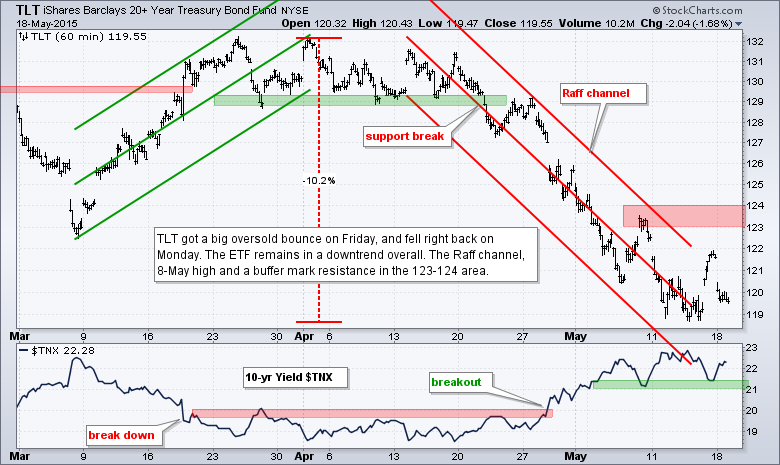
- TLT gave back its oversold bounce and remains in a downtrend.
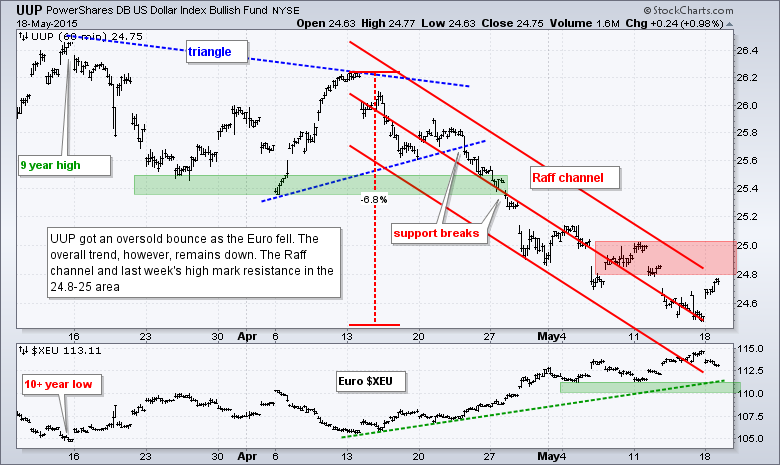
- UUP got an oversold bounce, but remains in a short-term downtrend.
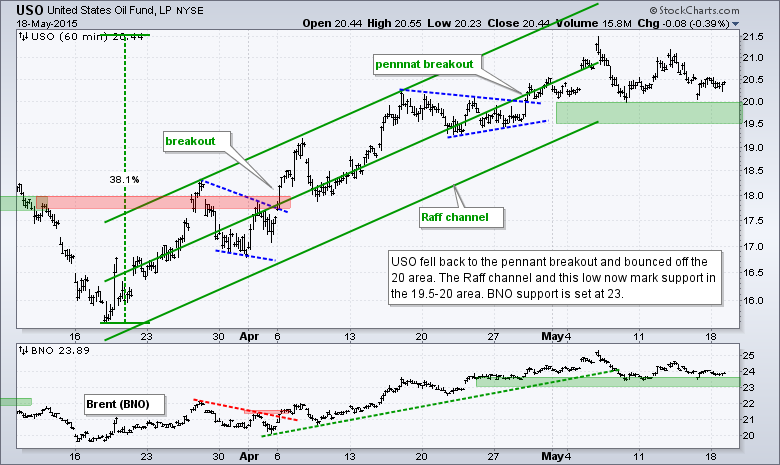
- USO remains above the pennant breakout zone and in a short-term uptrend.
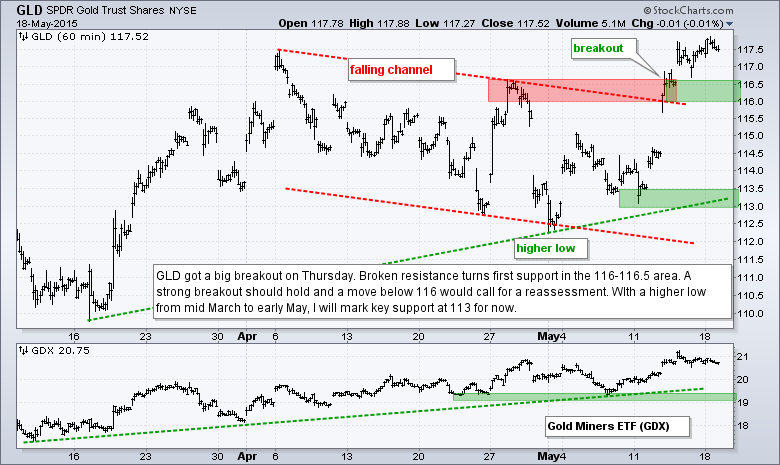
- GLD broke above its April highs last week and is holding this breakout.
The Equal-Weight S&P 500 ETF (RSP) edged higher and hit a new high to confirm the new high in SPY. The advance since mid March has been a slow slog, but it is an uptrend all the same. Even though slow and steady is not exciting, RSP continues to notch new highs and extend the uptrend.
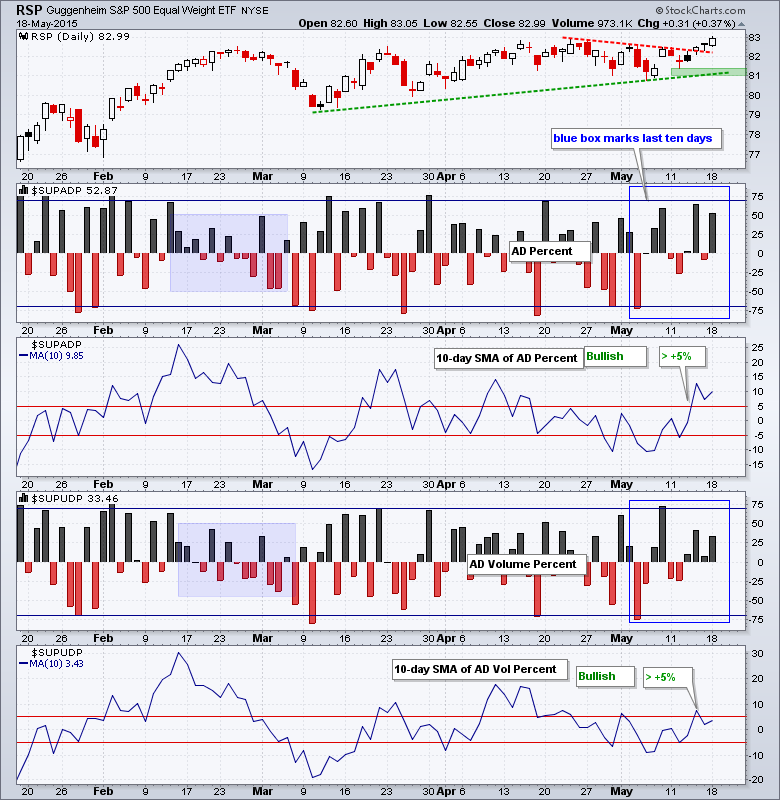
Breadth surged as AD Percent exceeded +50% for the third time in ten days. AD Volume Percent was not as strong (+33%). Don't look now, but the 10-day SMA for AD Percent is at +9.85% and easily outperforming the 10-day SMA for AD Volume Percent, which is at +3.43%. This favors small-caps and we could see a changing of the guard, especially if the Dollar strengthens.
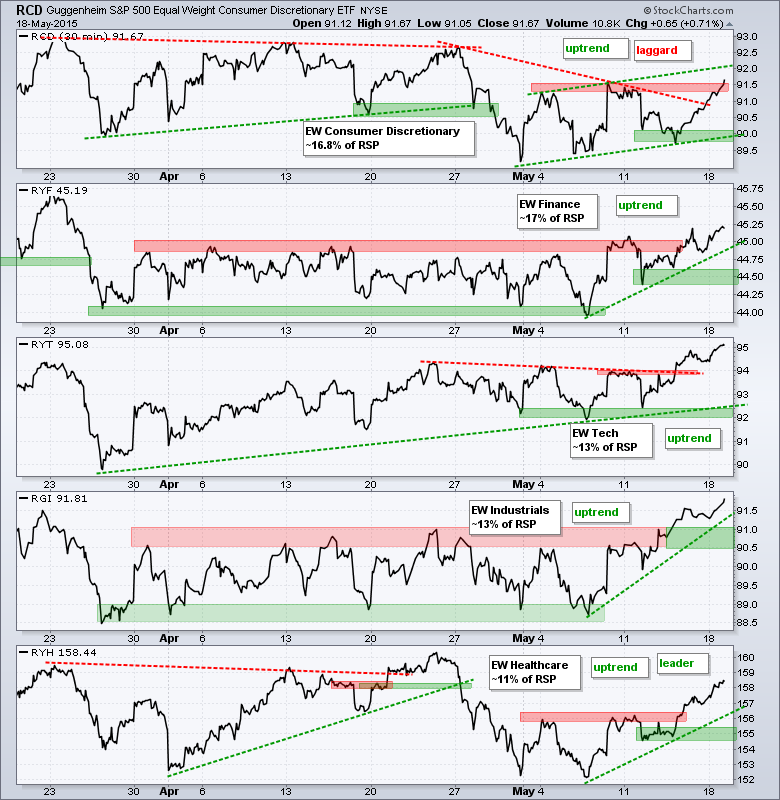
All five equal-weight sector ETFs are in uptrends. The Equal-Weight Consumer Discretionary ETF (RCD) moved above its early May high and has an uptrend working the last two weeks. It is, however, still a lagging sector. The Equal-weight Industrials ETF (RGI) had the most explosive move over the last two weeks and is the leader. I am also impressed with the Equal-weight Technology ETF (RYT) because it is close to its 52-week high.
**************************************************************
**************************************************************
**************************************************************
**************************************************************
**************************************************************
**************************************************************
**************************************************************
***************************************************************
Key Reports and Events (all times Eastern):
Tue - May 19 - 08:30 - Housing Starts/Building Permits
Wed - May 20 - 07:00 - MBA Mortgage Index
Wed - May 20 - 10:30 - Crude Oil Inventories
Wed - May 20 - 14:00 - FOMC Minutes
Thu - May 21 - 08:30 - Initial Jobless Claims
Thu - May 21 - 10:00 - Existing Home Sales
Thu - May 21 - 10:00 - Philadelphia Fed
Thu - May 21 - 10:00 - Leading Indicators
Thu - May 21 - 10:30 - Natural Gas Inventories
Fri - May 22 - 08:30 - Consumer Price Index (CPI)
Tue - May 26 - 08:30 - Durable Goods Orders
Tue - May 26 - 09:00 - Case-Shiller 20-city Index
Tue - May 26 - 09:00 - FHFA Housing Price Index
Tue - May 26 - 10:00 - New Home Sales
Tue - May 26 - 10:00 - Consumer Confidence
Wed - May 27 - 07:00 - MBA Mortgage Index
Thu - May 28 - 08:30 - Initial Jobless Claims
Thu - May 28 - 10:00 - Pending Home Sales
Thu - May 28 - 10:30 - Natural Gas Inventories
Thu - May 28 - 11:00 - Crude Oil Inventories
Fri - May 29 - 08:30 - GDP
Fri - May 29 - 09:45 - Chicago PMI
Fri - May 29 - 10:00 - Michigan Sentiment
This commentary is designed to stimulate thinking. This analysis is not a recommendation to buy, sell, hold or sell short any security (stock ETF or otherwise). We all need to think for ourselves when it comes to trading our own accounts. First, it is the only way to really learn. Second, we are the only ones responsible for our decisions. Think of these charts as food for further analysis. Before making a trade, it is important to have a plan. Plan the trade and trade the plan. Among other things, this includes setting a trigger level, a target area and a stop-loss level. It is also important to plan for three possible price movements: advance, decline or sideways. Have a plan for all three scenarios BEFORE making the trade. Consider possible holding times. And finally, look at overall market conditions and sector/industry performance.


