Stocks meandered on Tuesday with the S&P 500 trading on either side of 2130 the entire day. The ETF fell below 2130 in the afternoon and closed at 2127 (-.06%). The sectors were mostly lower with energy leading the decline. The Finance SPDR (XLF) was the strongest sector with a .56% advance and challenge to its December high. On a closing basis, XLF closed above the December high and hit a 52-week closing high. Can't argue with that. The Regional Bank SPDR (KRE) hit a new high with a 1% advance. Elsewhere, the Home Construction iShares (ITB) gained on better-than-expected housing starts and commodity-related stocks were hammered as the Dollar bounced.
**This chart analysis is for educational purposes only, and should not
be construed as a recommendation to buy, sell or sell-short said securities**
Short-term Overview (Wednesday, 20-May-2015):
- Short-term breadth indicators are bullish.
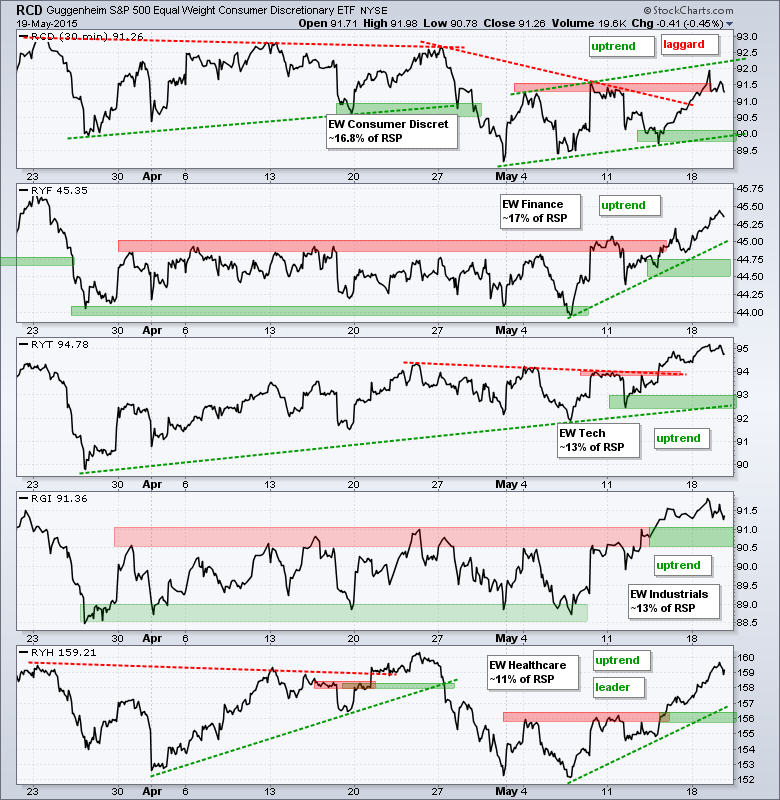
- All five equal-weight sectors are in uptrends.
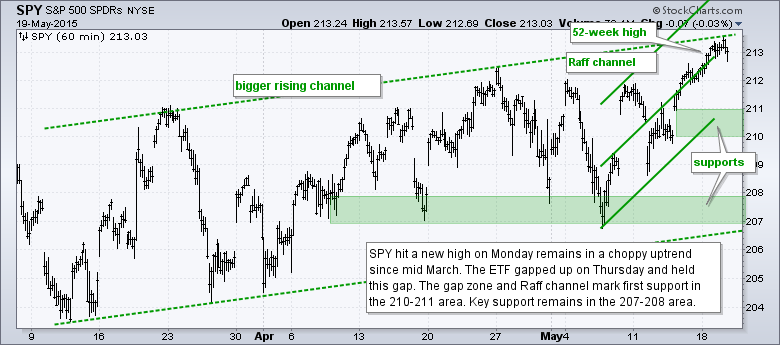
- SPY hit a new high and remains in a choppy uptrend.
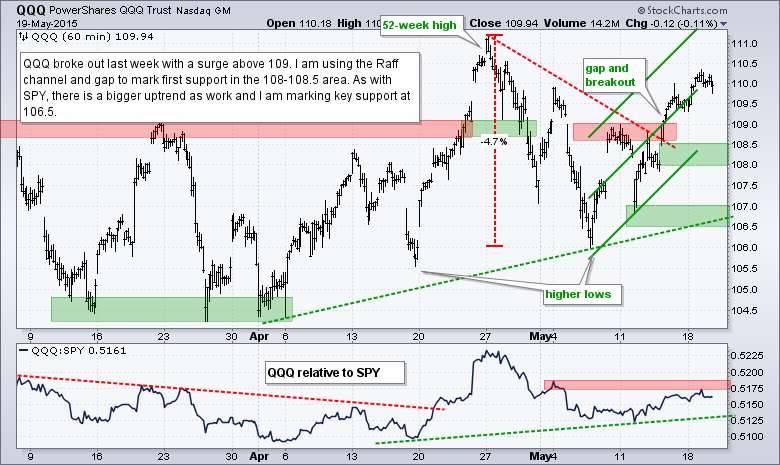
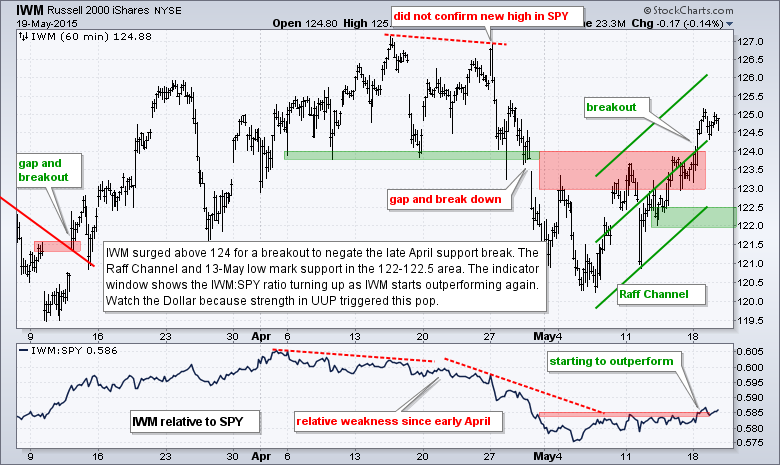
- QQQ and IWM remain in uptrends and support levels are unchanged.
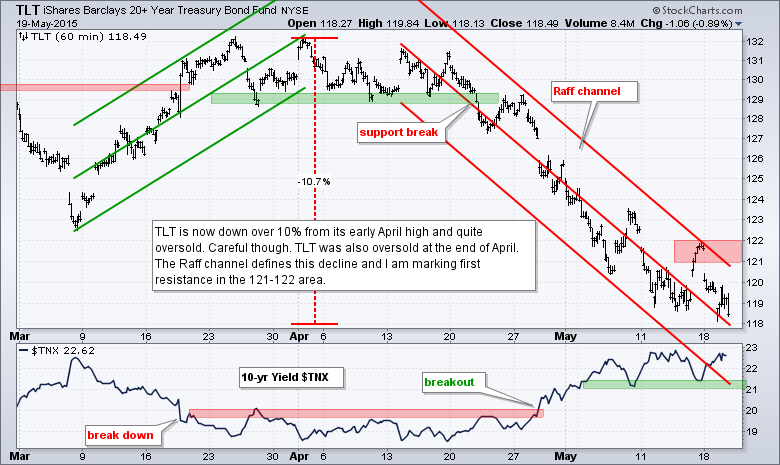
- TLT became even more oversold and remains in a short-term downtrend.
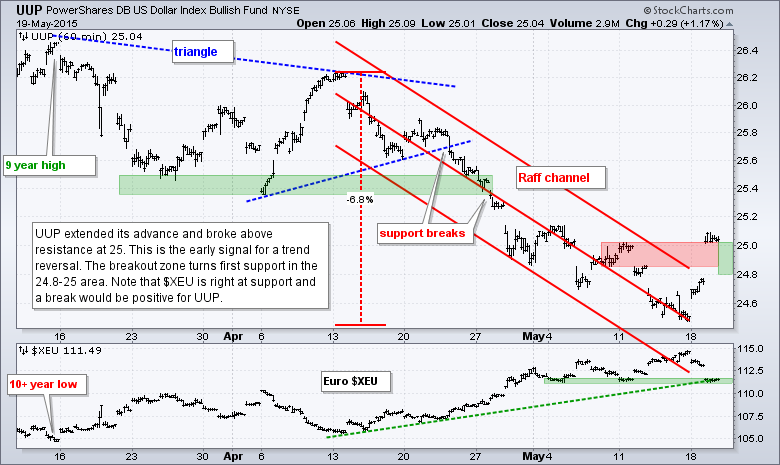
- UUP extended its bounce and broke resistance to reverse the short-term downtrend.
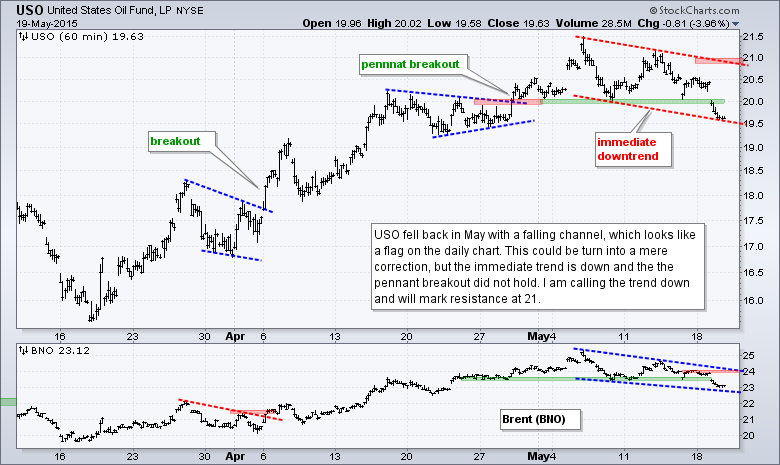
- USO failed to hold the pennant breakout and broke support to start a short-term downtrend.
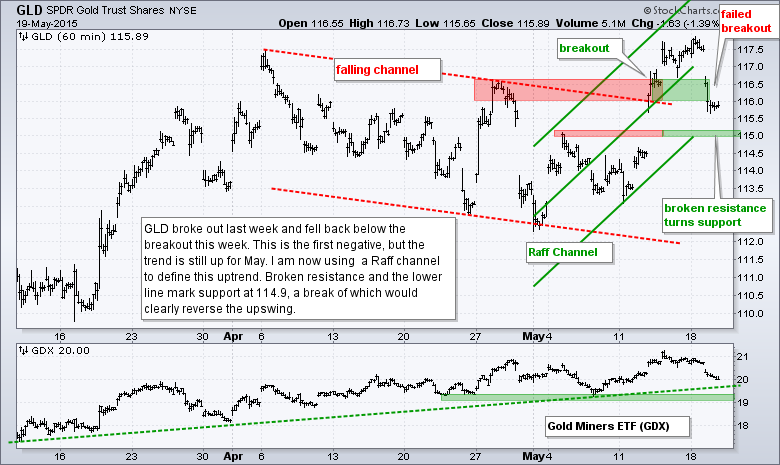
- GLD failed to hold last week's breakout, but the short-term trend is still up with new support levels.
The Equal-Weight S&P 500 ETF (RSP) fell back, but remains above the breakout zone in the 82-82.5 area. The March trend line and last week's low combine to mark support in the 81-81.5 area.
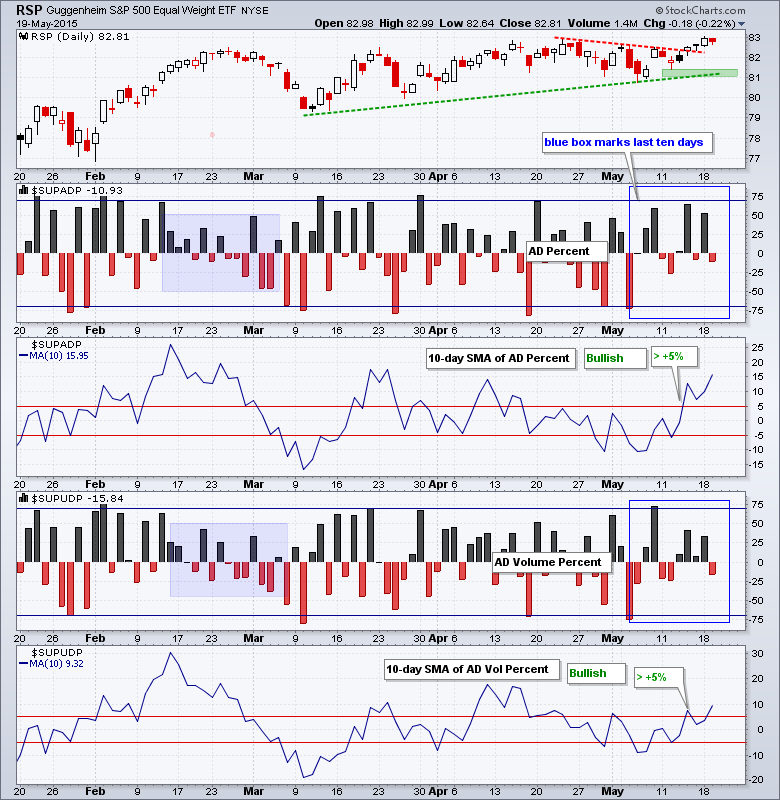
Breadth was slightly negative on Tuesday, which indicates modest selling pressure. A look at the last ten AD Percent bars shows three above +50% and none below -30%. Buying pressure has picked up the last ten days and selling pressure has diminished. The 10-day SMAs for AD Percent and AD Volume Percent are both in bull mode and not even close to turning bearish.
All five equal-weight sector ETFs are in uptrends. The Equal-Weight Consumer Discretionary ETF (RCD) remains the laggard and well below its April highs. The Equal-weight Healthcare ETF (RYH) is up over 4% from its May low and the leader. The Equal-weight Finance ETF (RYF) extended on its breakout and continues to show strength. The Equal-weight Industrials ETF (RGI) stalled out over the last four days, but the breakout is holding and remains bullish as long as the ETF holds above 90.50
**************************************************************
**************************************************************
**************************************************************
**************************************************************
**************************************************************
**************************************************************
**************************************************************
***************************************************************
Key Reports and Events (all times Eastern):
Tue - May 19 - 08:30 - Housing Starts/Building Permits
Wed - May 20 - 07:00 - MBA Mortgage Index
Wed - May 20 - 10:30 - Crude Oil Inventories
Wed - May 20 - 14:00 - FOMC Minutes
Thu - May 21 - 08:30 - Initial Jobless Claims
Thu - May 21 - 10:00 - Existing Home Sales
Thu - May 21 - 10:00 - Philadelphia Fed
Thu - May 21 - 10:00 - Leading Indicators
Thu - May 21 - 10:30 - Natural Gas Inventories
Fri - May 22 - 08:30 - Consumer Price Index (CPI)
Tue - May 26 - 08:30 - Durable Goods Orders
Tue - May 26 - 09:00 - Case-Shiller 20-city Index
Tue - May 26 - 09:00 - FHFA Housing Price Index
Tue - May 26 - 10:00 - New Home Sales
Tue - May 26 - 10:00 - Consumer Confidence
Wed - May 27 - 07:00 - MBA Mortgage Index
Thu - May 28 - 08:30 - Initial Jobless Claims
Thu - May 28 - 10:00 - Pending Home Sales
Thu - May 28 - 10:30 - Natural Gas Inventories
Thu - May 28 - 11:00 - Crude Oil Inventories
Fri - May 29 - 08:30 - GDP
Fri - May 29 - 09:45 - Chicago PMI
Fri - May 29 - 10:00 - Michigan Sentiment
This commentary is designed to stimulate thinking. This analysis is not a recommendation to buy, sell, hold or sell short any security (stock ETF or otherwise). We all need to think for ourselves when it comes to trading our own accounts. First, it is the only way to really learn. Second, we are the only ones responsible for our decisions. Think of these charts as food for further analysis. Before making a trade, it is important to have a plan. Plan the trade and trade the plan. Among other things, this includes setting a trigger level, a target area and a stop-loss level. It is also important to plan for three possible price movements: advance, decline or sideways. Have a plan for all three scenarios BEFORE making the trade. Consider possible holding times. And finally, look at overall market conditions and sector/industry performance.â


