The S&P 500 finished the week with a gain, but was hit with selling pressure in the final hour on Friday. For the week, the index surged on Monday and then traded flat from Tuesday to Friday. Small-caps led Friday's pullback as the Russell 2000 iShares (IWM) lost around .43%. The sectors were mixed with consumer discretionary, industrials and consumer staples weakening. Finance, technology and healthcare had some pockets of strength. There were two important trend reversals last week. The Dollar broke out and reversed its short-term downtrend while oil broke down and reversed its short-term uptrend. The major index ETFs remain in uptrends, but IWM remains well below its April highs and QQQ is still lagging SPY.
**This chart analysis is for educational purposes only, and should not
be construed as a recommendation to buy, sell or sell-short said securities**
Short-term Overview (Tuesday, 26-May-2015):
- Short-term breadth indicators are bullish.
- All five equal-weight sectors are in uptrends.
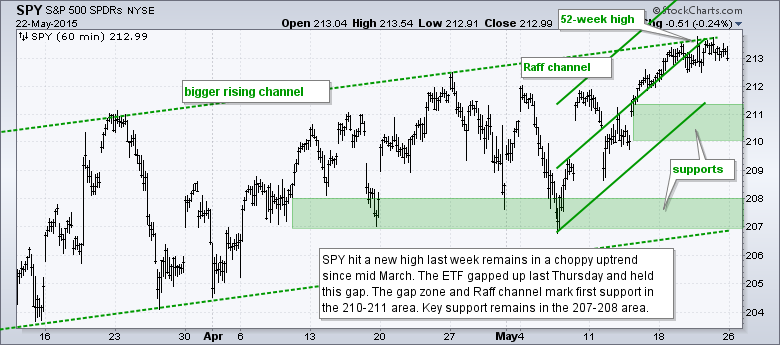
- SPY hit a new high last week and remains in a choppy uptrend.
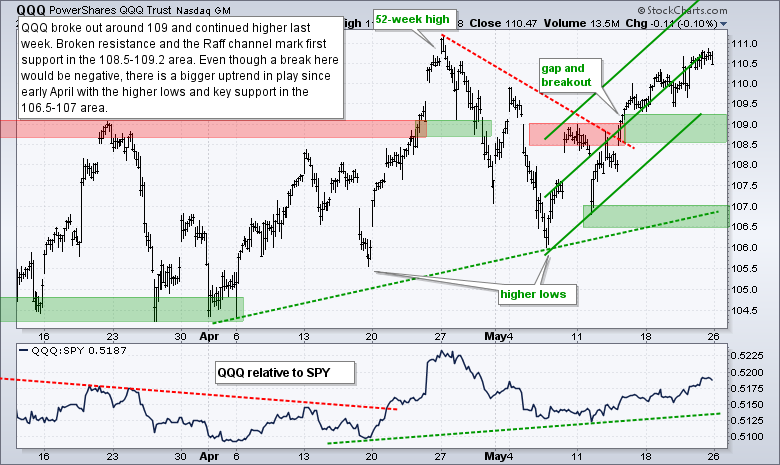
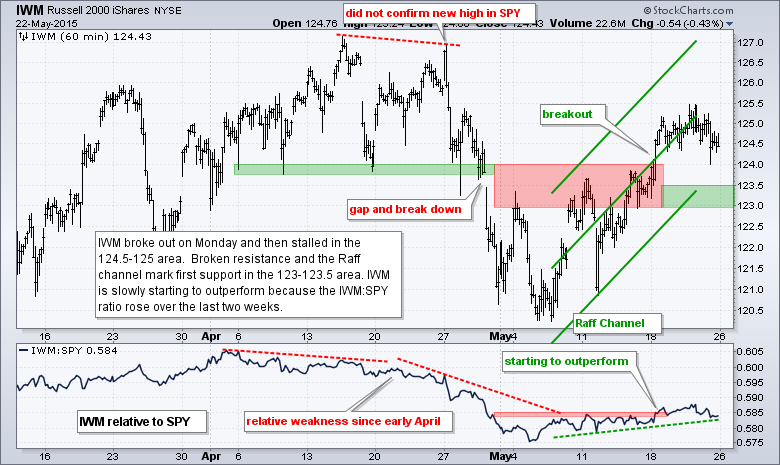
- QQQ and IWM remain in uptrends.
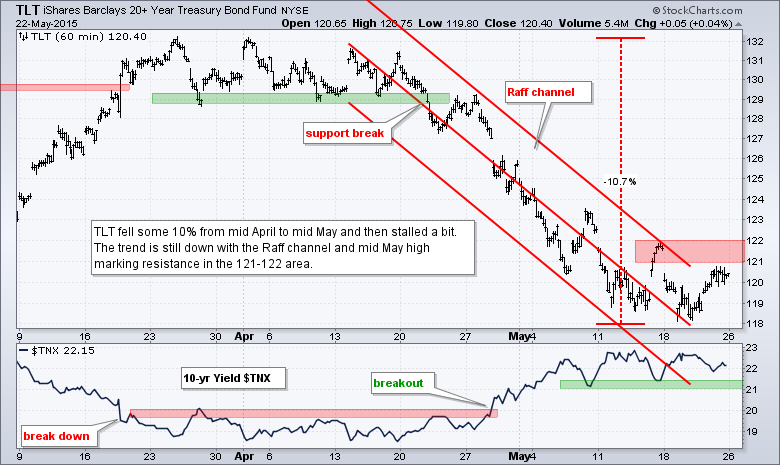
- TLT is firming after becoming oversold, but remains in a short-term downtrend.
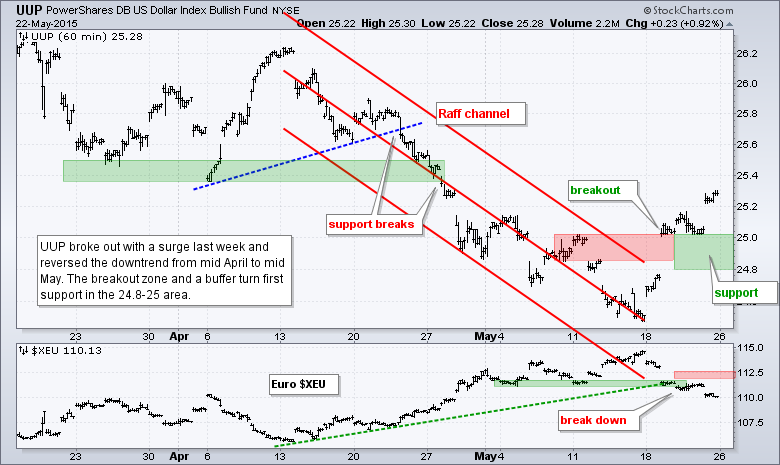
- UUP broke out last week and the short-term trend is up.
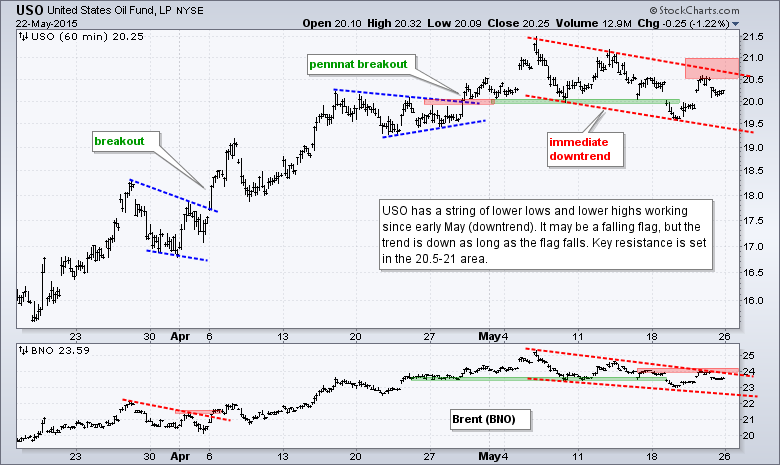
- USO has a series of lower lows and lower highs working since early May (downtrend)
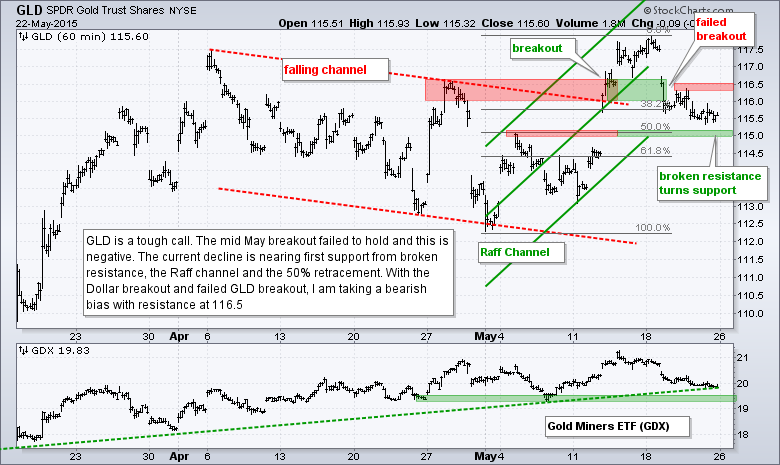
- GLD failed to hold last week's breakout and I am taking a bearish bias with a tight resistance level.
The Equal-Weight S&P 500 ETF (RSP) finished slightly lower on Friday and ended the week with some seriously indecisive trading. Overall, the gap from May 8th and trend line break from May 14th are holding, and bullish. The mid May low and mid March trend line combine to mark support in the 81-81.5 area.
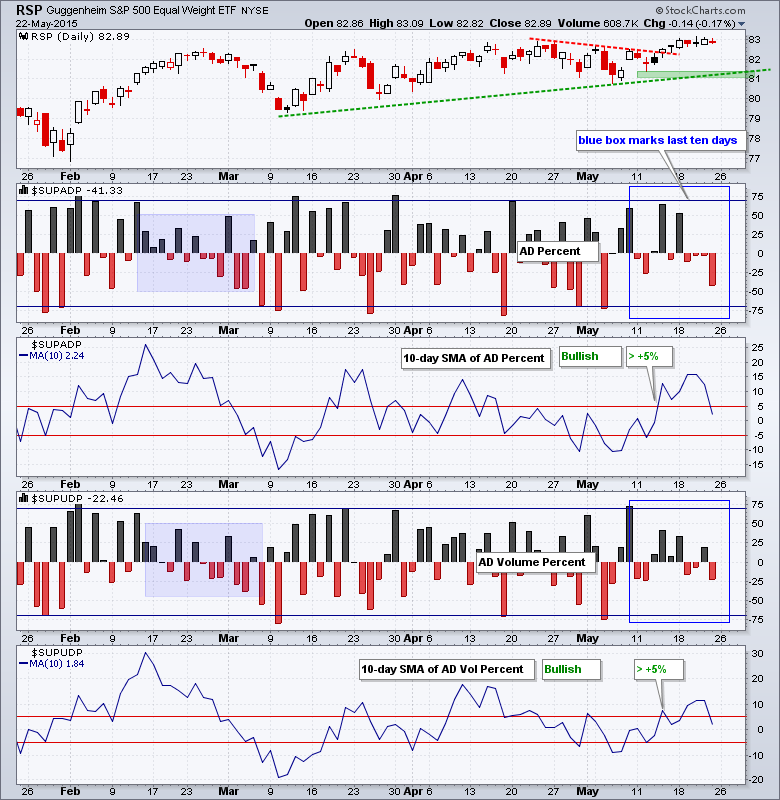
With some late selling pressure on Friday. AD Percent and AD Volume Percent dipped into negative territory. Selling pressure, however, was not that intense because neither exceeded -42%. Overall, the 10-day SMAs are in bull mode and will remain so until they move below -5%.
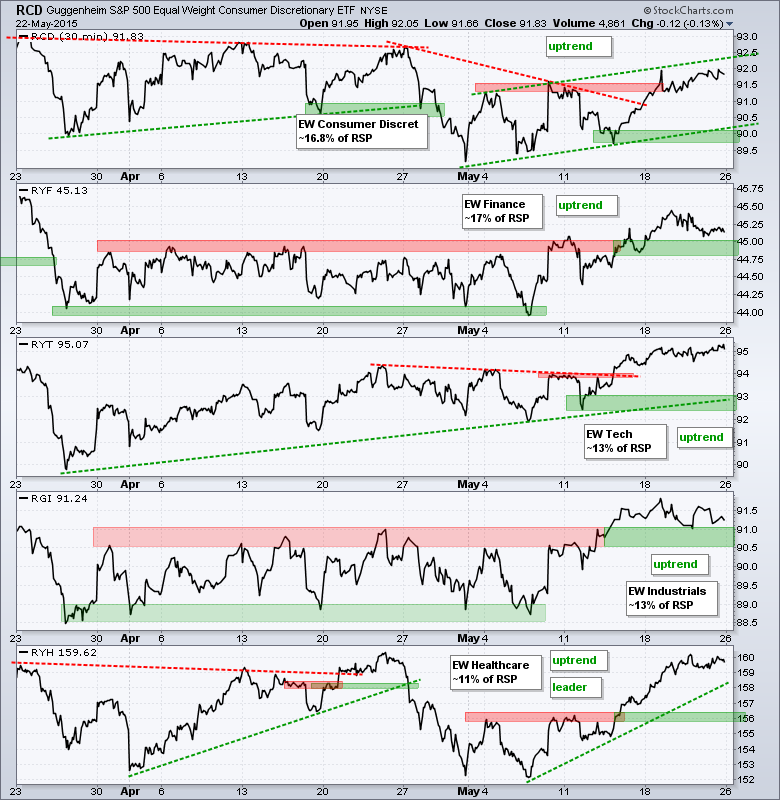
All five equal-weight sector ETFs are in uptrends. Based on the last seven trading days, the Equal-Weight Consumer Discretionary ETF (RCD) and the Equal-weight Technology ETF (RYT) are leading because they ended the week near their highs for the month. The Equal-weight Finance ETF (RYF) and Equal-weight Industrials ETF (RGI) weakened somewhat and formed lower highs last week. Nevertheless, the overall trends remain up.
**************************************************************
**************************************************************
**************************************************************
**************************************************************
**************************************************************
**************************************************************
**************************************************************
***************************************************************
Key Reports and Events (all times Eastern):
Tue - May 26 - 08:30 - Durable Goods Orders
Tue - May 26 - 09:00 - Case-Shiller 20-city Index
Tue - May 26 - 09:00 - FHFA Housing Price Index
Tue - May 26 - 10:00 - New Home Sales
Tue - May 26 - 10:00 - Consumer Confidence
Wed - May 27 - 07:00 - MBA Mortgage Index
Thu - May 28 - 08:30 - Initial Jobless Claims
Thu - May 28 - 10:00 - Pending Home Sales
Thu - May 28 - 10:30 - Natural Gas Inventories
Thu - May 28 - 11:00 - Crude Oil Inventories
Fri - May 29 - 08:30 - GDP
Fri - May 29 - 09:45 - Chicago PMI
Fri - May 29 - 10:00 - Michigan Sentiment
This commentary is designed to stimulate thinking. This analysis is not a recommendation to buy, sell, hold or sell short any security (stock ETF or otherwise). We all need to think for ourselves when it comes to trading our own accounts. First, it is the only way to really learn. Second, we are the only ones responsible for our decisions. Think of these charts as food for further analysis. Before making a trade, it is important to have a plan. Plan the trade and trade the plan. Among other things, this includes setting a trigger level, a target area and a stop-loss level. It is also important to plan for three possible price movements: advance, decline or sideways. Have a plan for all three scenarios BEFORE making the trade. Consider possible holding times. And finally, look at overall market conditions and sector/industry performance.


