Stocks did the old pop and drop as the S&P 500 surged to 2135 after the Fed minutes and then plunged back to its starting point (2125). The index ended the day unchanged and nothing has changed regarding the trend. Yesterday's pop and drop was just noise and the short-term trend is up. The sectors were mixed with small gains and loses. Elsewhere, the Media ETF (PBS) popped for a 1.22% gain as Time Warner Cable (TWC) surged over 5% on takeover rumors. The Leisure and Entertainment ETF (PEJ) plunged over 2% as airlines weighed heavily. Note that DAL, AAL, LUV, UAL and HA account for around 18% of PEJ. The Solar Energy ETF (TAN) was hammered for an 8% loss because one of its top holdings, Hanenergy, plunged some 47% before being suspended in Hong Kong trading. And finally, biotechs remain one of the strongest groups as the Biotech SPDR (XBI) advanced over 1% and neared its April high.
**This chart analysis is for educational purposes only, and should not
be construed as a recommendation to buy, sell or sell-short said securities**
Short-term Overview (Wednesday, 20-May-2015):
- Short-term breadth indicators are bullish.
- All five equal-weight sectors are in uptrends.
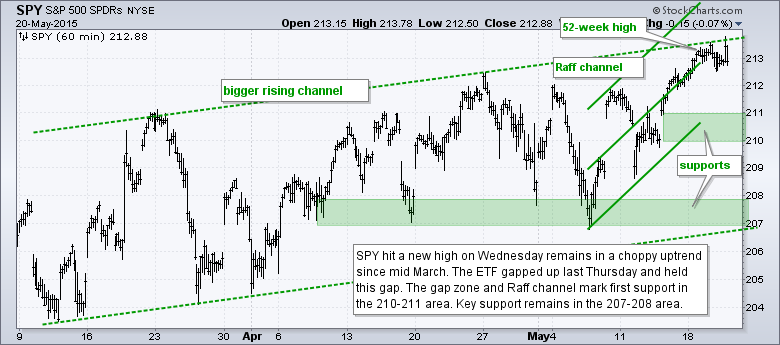
- SPY hit a new high Wednesday and remains in a choppy uptrend.
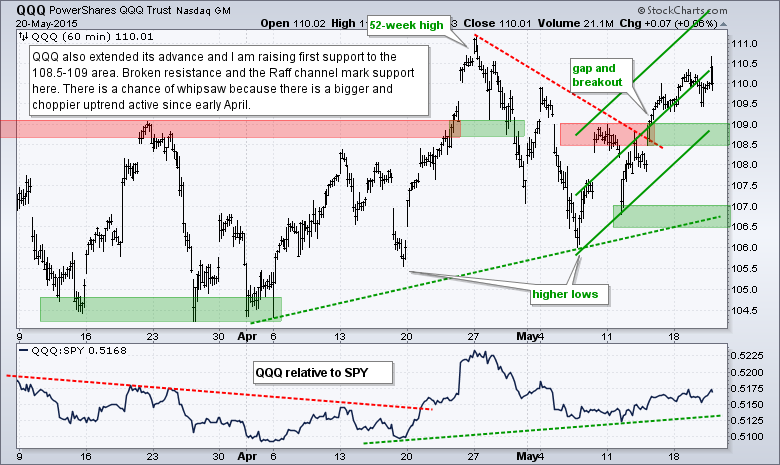
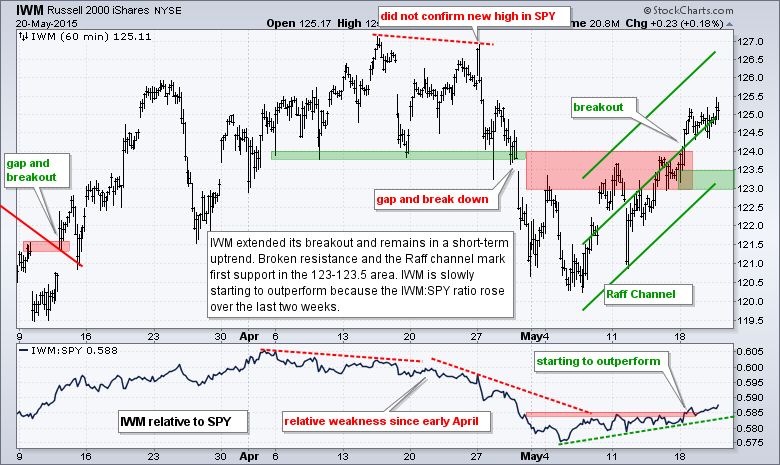
- QQQ and IWM remain in uptrends and I raised the first support levels.
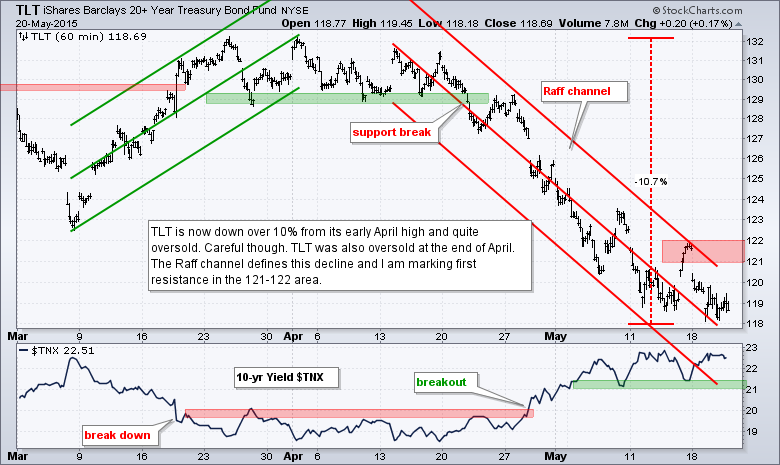
- TLT is extremely oversold and in a short-term downtrend.
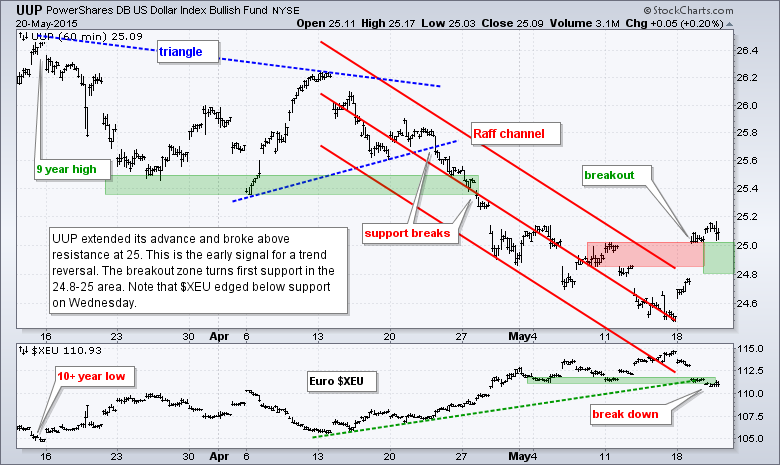
- UUP broke out on Tuesday and this breakout is holding.
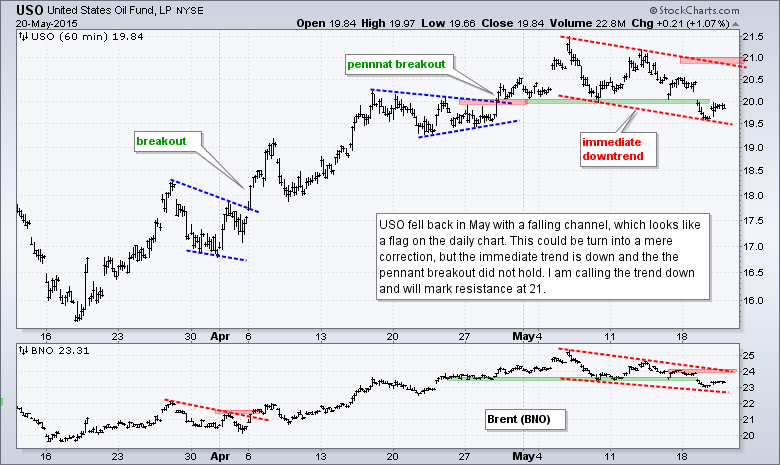
- USO broke short-term support on Tuesday and remains in a short-term downtrend.
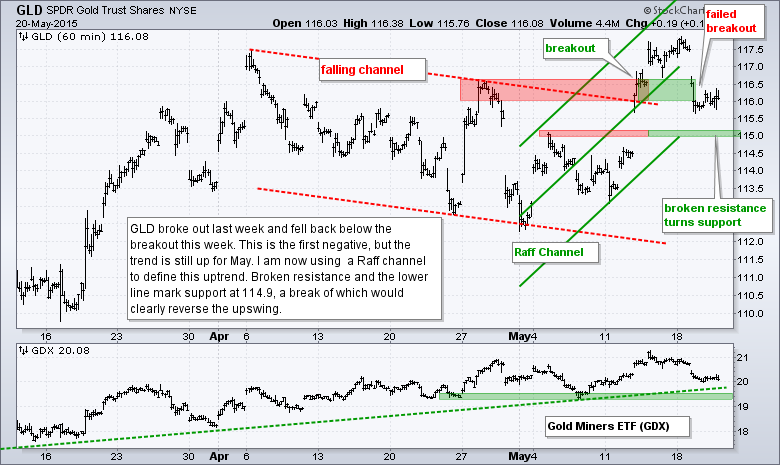
- GLD failed to hold last week's breakout, but the trend in May (two weeks) is up.
The Equal-Weight S&P 500 ETF (RSP) stalled on Wednesday with an indecisive candlestick (doji). These candlesticks form when the open and close are pretty much equal and the high-low range is relatively small. They look like a plus sign. Overall, last week's breakout is holding and the slow upward slog remains in play. I am marking support in the 81-81.5 area.
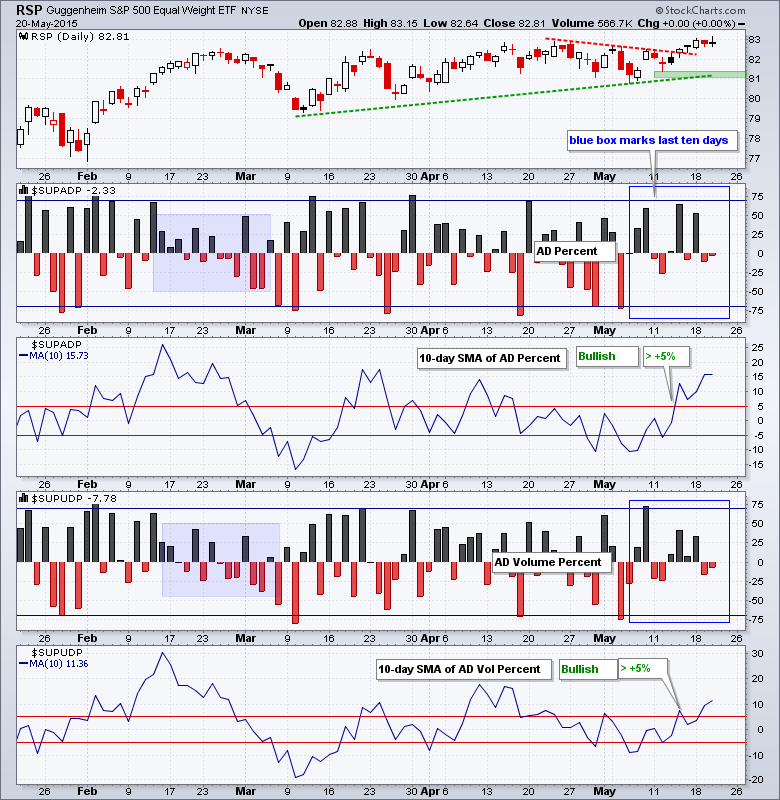
Breadth was slightly negative again on Wednesday and nothing has changed. The 10-day SMAs average it out and remain in bull mode.
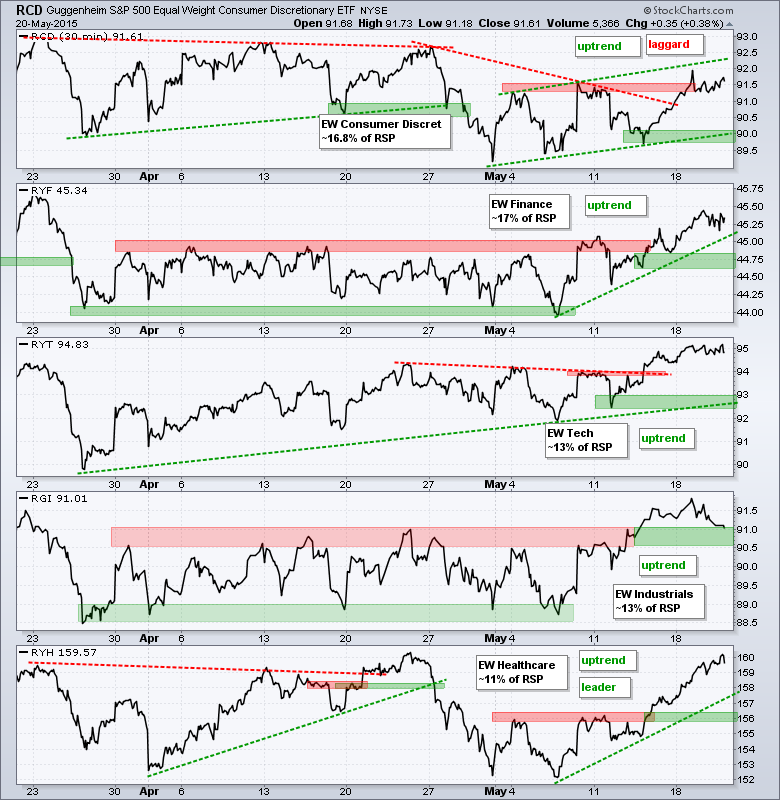
There is no change here as all five equal-weight sector ETFs remain in uptrends. The Equal-Weight Consumer Discretionary ETF (RCD) remains the laggard and well below its April highs. The Equal-weight Healthcare ETF (RYH) is up over 4% from its May low and the leader. The Equal-weight Finance ETF (RYF) extended on its breakout and continues to show strength. The Equal-weight Industrials ETF (RGI) stalled out over the last five days, but the breakout is holding and remains bullish as long as the ETF holds above 90.50
**************************************************************
**************************************************************
**************************************************************
**************************************************************
**************************************************************
**************************************************************
**************************************************************
***************************************************************
Key Reports and Events (all times Eastern):
Thu - May 21 - 08:30 - Initial Jobless Claims
Thu - May 21 - 10:00 - Existing Home Sales
Thu - May 21 - 10:00 - Philadelphia Fed
Thu - May 21 - 10:00 - Leading Indicators
Thu - May 21 - 10:30 - Natural Gas Inventories
Fri - May 22 - 08:30 - Consumer Price Index (CPI)
Tue - May 26 - 08:30 - Durable Goods Orders
Tue - May 26 - 09:00 - Case-Shiller 20-city Index
Tue - May 26 - 09:00 - FHFA Housing Price Index
Tue - May 26 - 10:00 - New Home Sales
Tue - May 26 - 10:00 - Consumer Confidence
Wed - May 27 - 07:00 - MBA Mortgage Index
Thu - May 28 - 08:30 - Initial Jobless Claims
Thu - May 28 - 10:00 - Pending Home Sales
Thu - May 28 - 10:30 - Natural Gas Inventories
Thu - May 28 - 11:00 - Crude Oil Inventories
Fri - May 29 - 08:30 - GDP
Fri - May 29 - 09:45 - Chicago PMI
Fri - May 29 - 10:00 - Michigan Sentiment
This commentary is designed to stimulate thinking. This analysis is not a recommendation to buy, sell, hold or sell short any security (stock ETF or otherwise). We all need to think for ourselves when it comes to trading our own accounts. First, it is the only way to really learn. Second, we are the only ones responsible for our decisions. Think of these charts as food for further analysis. Before making a trade, it is important to have a plan. Plan the trade and trade the plan. Among other things, this includes setting a trigger level, a target area and a stop-loss level. It is also important to plan for three possible price movements: advance, decline or sideways. Have a plan for all three scenarios BEFORE making the trade. Consider possible holding times. And finally, look at overall market conditions and sector/industry performance.


